Home › FX Trading School › Advanced
Walk-Forward Analysis Explained (Module 17: Validation)
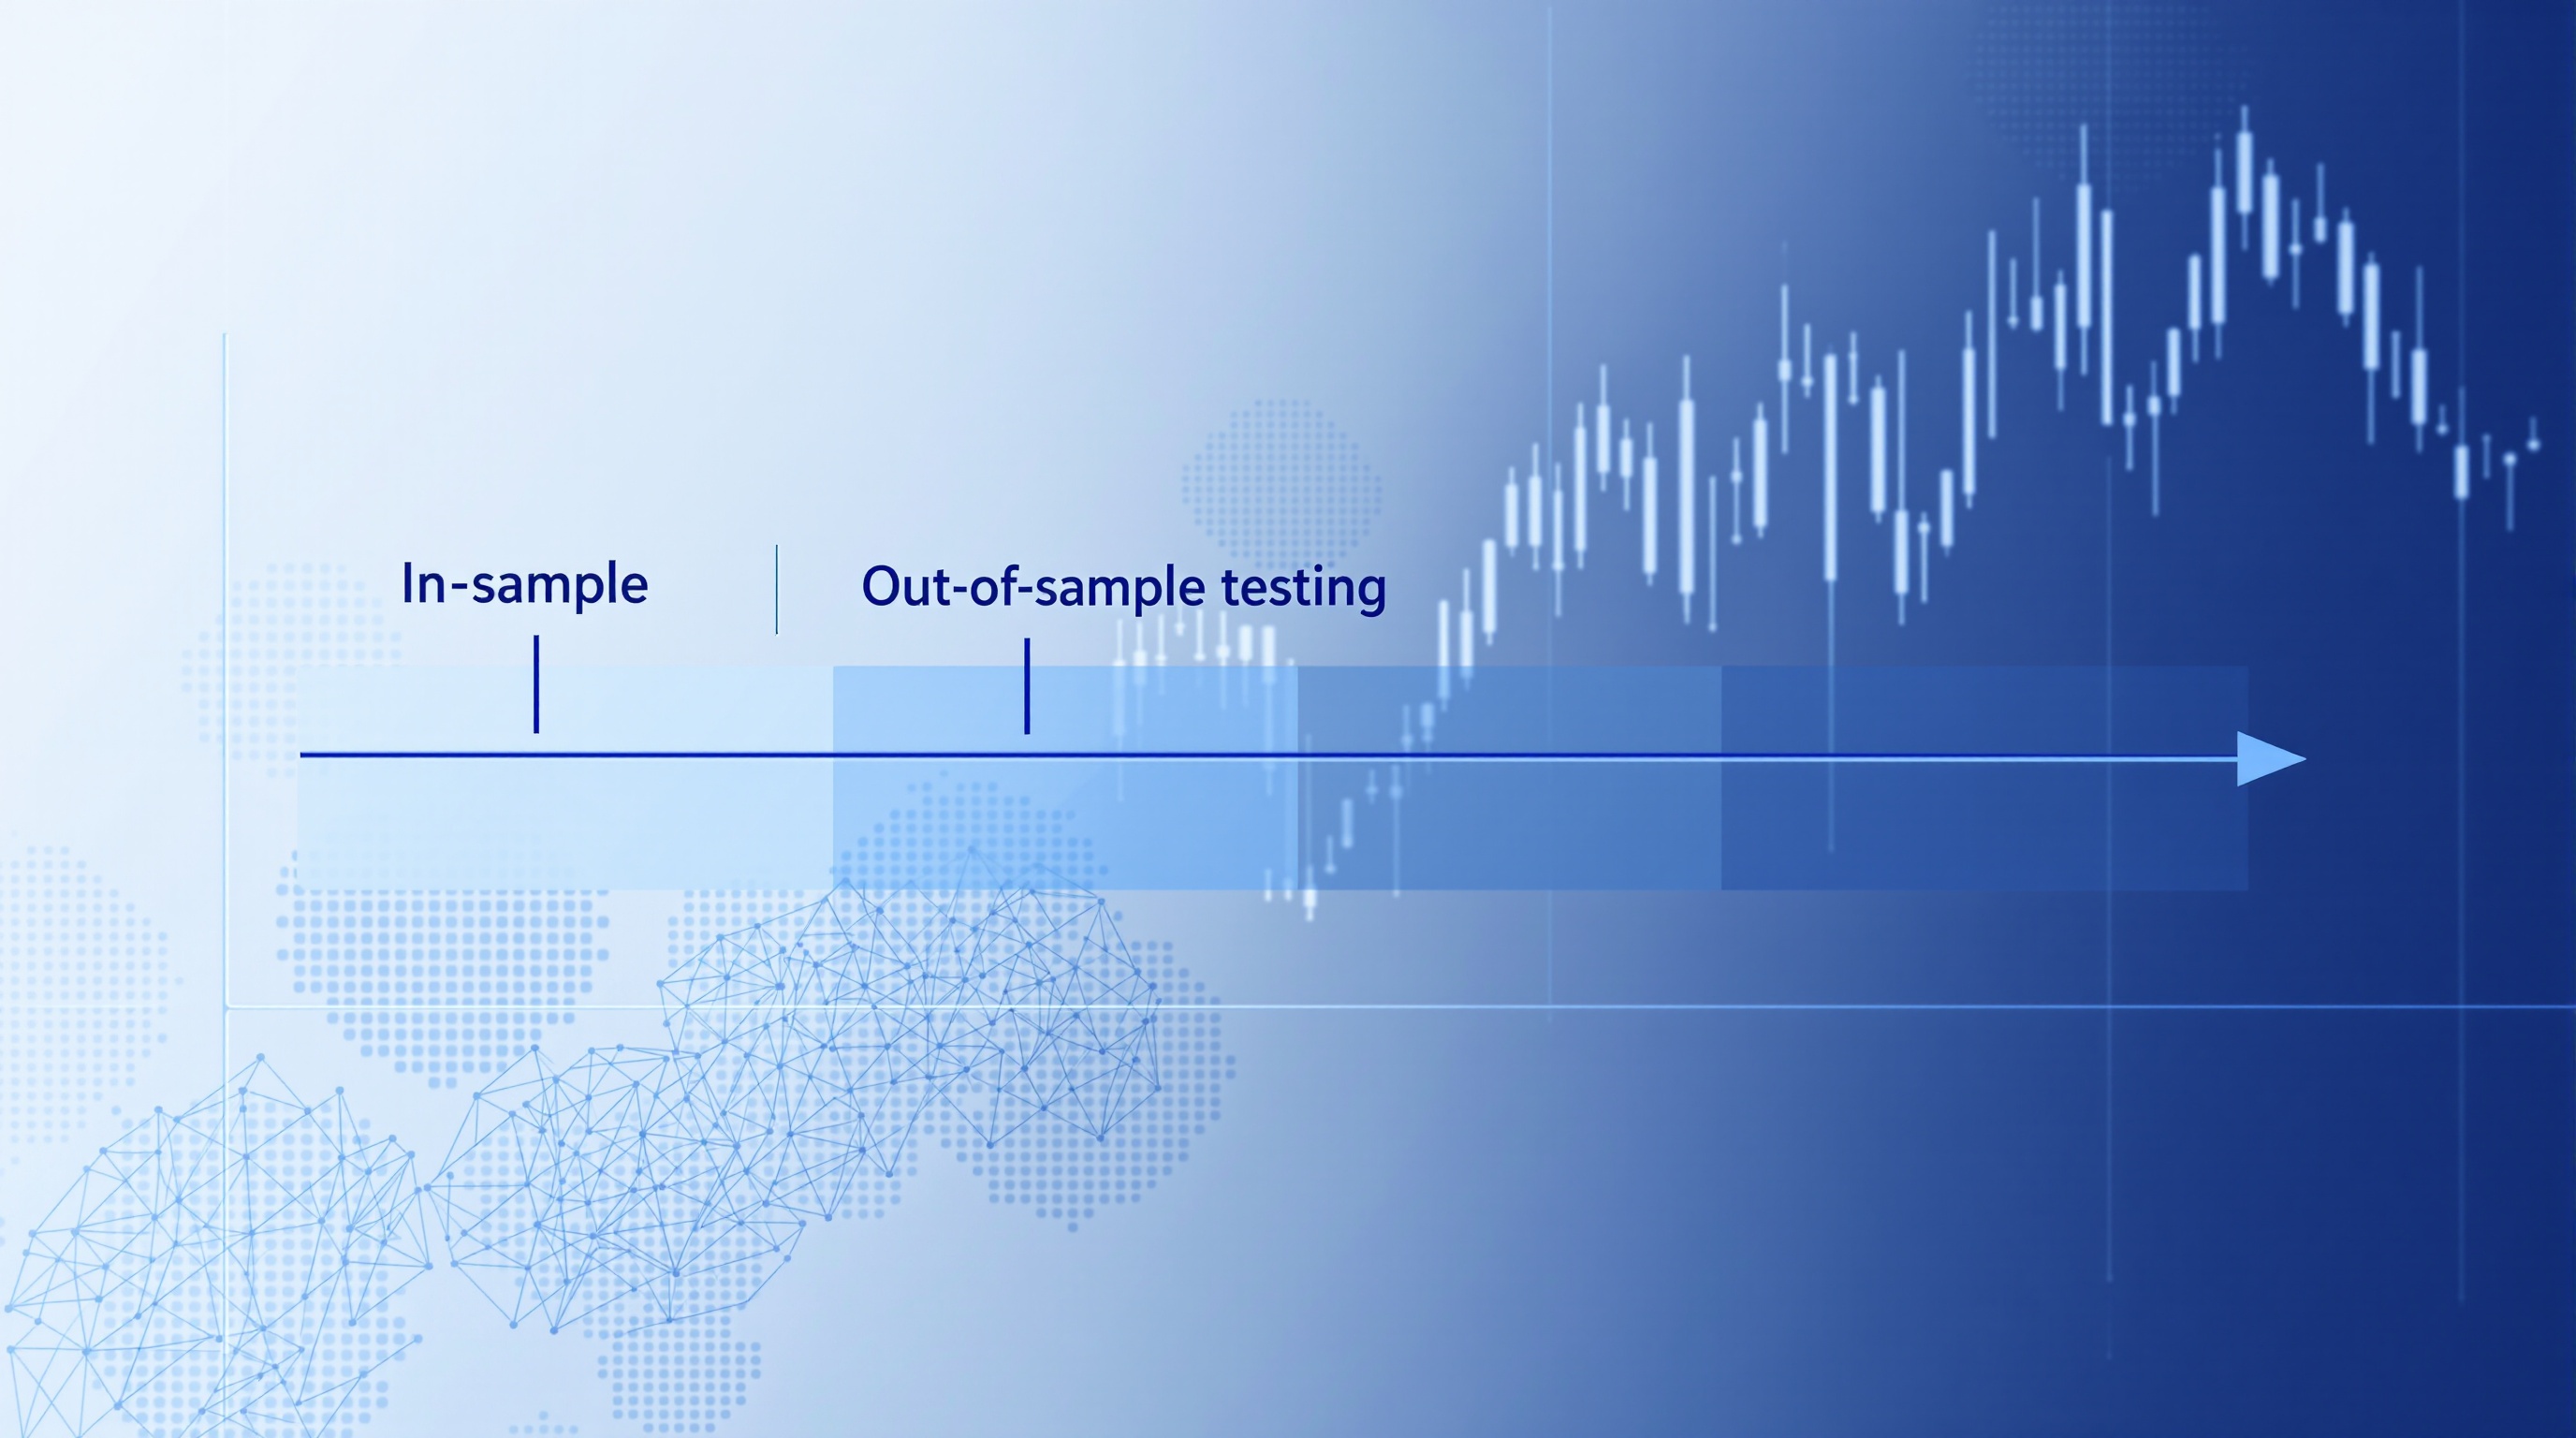
Walk-forward analysis is the validation step that separates a strategy which merely fits history from one that might actually survive contact with the future. If you've built and optimised a rule-based system, this is Module 17 in the PipTax FX Trading School's Validation track — and it assumes you're already comfortable with backtesting and the concept of curve-fitting from earlier modules.
By this stage you should have a strategy with defined entry and exit rules, a set of optimised parameters, and a backtest that looks promising. Walk-forward analysis exists to test whether that promise is real or an illusion built from too much fitting to one dataset.
What Walk-Forward Analysis Actually Tests
A standard backtest asks: "did this strategy work over this historical period?" Walk-forward analysis asks a harder, more useful question: "does this strategy keep working when re-optimised and applied to data it has never seen?"
The method works by splitting your history into a series of rolling windows:
- In-sample (IS) window — the data you optimise parameters on.
- Out-of-sample (OOS) window — the immediately following period, untouched during optimisation, where you simply apply the parameters you found and record the result.
You then roll both windows forward in time and repeat the process, chaining together a series of OOS segments. Stitch those OOS results end to end and you get a much more honest equity curve than any single in-sample backtest — because every segment of it was generated on data the optimiser never saw.
This matters because markets aren't static. A parameter set tuned on 2019–2021 EUR/USD behaviour may be worthless in a different volatility regime. Walk-forward analysis forces your strategy to prove itself repeatedly, on fresh data, rather than once on a single lucky sample.
Anchored vs Rolling Windows
There are two common ways to structure the windows, and the choice affects what you're actually testing.
Rolling (unanchored) window: - Fixed-length IS window slides forward each step. - Older data drops off as new data is added. - Better reflects a strategy adapting to *recent* conditions only.
Anchored window: - IS start date stays fixed; the window grows longer each step. - All history is retained and reused in optimisation. - Better reflects a strategy that should work across a wide variety of regimes, not just recent ones.
Neither is objectively correct — it depends on what you believe about the strategy. A mean-reversion system tied to short-term volatility clusters might suit rolling windows. A structural trend-following system might suit anchored windows, since you want it proven across multiple cycles, not just the last one.
Whichever you choose, keep the OOS window length consistent and reasonably meaningful — testing on three days of OOS data tells you almost nothing.
Building a Walk-Forward Test Step by Step
A practical, no-nonsense process:
1. Split your full dataset into sequential IS/OOS pairs (e.g. 12 months IS, 3 months OOS, rolled forward quarterly). 2. Optimise parameters on each IS window only, using whatever process you'd normally use (grid search, genetic algorithm, manual sweep). 3. Lock those parameters and run them, unchanged, on the following OOS window. No peeking, no adjusting. 4. Record the OOS result — trades, return, drawdown — and move on. 5. Roll forward to the next window and repeat until you've covered the full dataset. 6. Stitch all OOS segments together into one continuous equity curve.
This is mechanical and slightly tedious by hand, which is why most traders script it in their platform of choice — MetaTrader's Strategy Tester with custom optimisation logic, or a Python/pandas backtesting framework, are common routes. The discipline of "optimise here, test there, never mix" is the entire point.
Reading Your Walk-Forward Efficiency
Once you have the stitched OOS curve, compare it against the in-sample results using the walk-forward efficiency (WFE) ratio:
$$WFE = \frac{\text{Out-of-sample performance}}{\text{In-sample performance}}$$
Rough guide to interpretation:
| WFE Ratio | What it suggests | |---|---| | Above 0.6–0.7 | Reasonably robust; OOS holds up close to IS | | 0.3–0.6 | Weak generalisation; treat with caution | | Below 0.3 or negative | Likely curve-fitted; the strategy doesn't survive fresh data |
Don't treat these bands as gospel — they're a sense-check, not a pass/fail exam. A strategy with modest but consistent positive OOS results across many windows is more trustworthy than one with one spectacular IS number and a collapsing WFE ratio.
Also look at consistency across windows, not just the average. A strategy that's profitable in 9 of 12 OOS windows tells a different story than one profitable in 12 of 12 with wildly varying magnitude — the latter may be dominated by one lucky segment.
Common Mistakes That Invalidate the Test
Walk-forward analysis is only as honest as its execution. Watch for:
- Information leakage — accidentally letting OOS data influence IS optimisation (e.g. choosing your overall date range because you already know what happens in the last quarter).
- Re-optimising too often — if you re-tune parameters every single OOS window with wildly different results each time, your strategy has no stable logic; it's chasing noise.
- Ignoring costs — every IS and OOS run must include realistic spread, commission, and swap assumptions, or the whole exercise is fiction. This is where a real cost baseline matters: check current live spreads and commissions with the [PipTax cost tool](/audit.html) or compare broker execution models on the [brokers directory](/brokers/index.html) before finalising assumptions, since PipTax never fabricates specific broker numbers in lessons — you should always pull them live.
- Too few windows — three or four OOS segments isn't a statistically meaningful sample; aim for enough windows to cover multiple market regimes.
- Cherry-picking the best window — the whole point is the stitched, full-period result, not your best quarter.
Walk-Forward Analysis vs Monte Carlo Simulation
These two are complementary, not competing. Walk-forward analysis tests robustness across time — does the strategy adapt as markets evolve. Monte Carlo simulation (a separate module in this course) tests robustness across sequence — reshuffling the order of trades to see how sensitive your results are to a specific run of luck.
A strategy that passes both is in a stronger position than one that passes either alone. If you haven't covered Monte Carlo methods yet, it's worth returning to walk-forward analysis afterwards with both tools in hand — they catch different kinds of overfitting.
Bringing It Into Your Own Workflow
Practical next steps for putting this into practice:
- Pick a strategy you've already backtested and re-run it with a rolling or anchored walk-forward split.
- Use realistic, current cost assumptions — pull them from the [PipTax cost tool](/audit.html) rather than guessing, and cross-check execution style (say, Pepperstone's MetaTrader server environment versus IG's own platform) since spreads and fill behaviour differ by venue.
- Calculate your WFE ratio and note consistency across windows, not just the headline average.
- If results are weak, resist the urge to simply re-optimise until the number looks better — that reintroduces the exact curve-fitting problem walk-forward analysis is meant to catch.
Walk-forward analysis won't make a bad strategy good, and it won't guarantee live results will match your OOS curve — real markets add slippage, changing liquidity, and behavioural pressure that no backtest fully captures. What it does give you is a far more honest read on whether your edge is structural or accidental, which is exactly why it sits at Module 17 in the Validation track: it's the test you run after you've already learned to backtest and to spot curve-fitting, and before you ever risk real capital.
Key takeaways
- Walk-forward analysis re-optimises a strategy on rolling in-sample windows and tests it, unchanged, on the following out-of-sample window - repeated across the full dataset.
- Stitching together all out-of-sample segments gives a far more honest equity curve than a single in-sample backtest.
- Choose anchored windows for strategies meant to hold across many regimes, and rolling windows for strategies meant to adapt to recent conditions only.
- The walk-forward efficiency ratio (OOS performance divided by IS performance) is a useful sense-check, not a strict pass/fail test - consistency across windows matters just as much.
- Always test with realistic, current spread and commission assumptions from the PipTax cost tool rather than guessed figures.
- Walk-forward analysis and Monte Carlo simulation test different kinds of overfitting - time-based robustness versus sequence-based robustness - and work best used together.
Frequently asked questions
- What's the difference between backtesting and walk-forward analysis?
- A standard backtest optimises and tests on the same historical data, which risks curve-fitting. Walk-forward analysis splits data into sequential in-sample and out-of-sample windows, so parameters are always tested on data the optimiser never saw, giving a more honest read on robustness.
- How many walk-forward windows do I need for a meaningful test?
- There's no fixed number, but a handful of windows (three or four) is generally too few to be statistically meaningful. Aim to cover multiple market regimes — different volatility conditions and at least one significant trend and range period — which usually means eight or more windows depending on your data length.
- What is a good walk-forward efficiency ratio?
- As a rough guide, a WFE above roughly 0.6-0.7 suggests reasonable robustness, 0.3-0.6 is weak, and below 0.3 (or negative) suggests the strategy is likely curve-fitted. Treat these as sense-checks rather than strict pass/fail thresholds, and always look at consistency across windows too.
- Should I use anchored or rolling windows for walk-forward analysis?
- It depends on the strategy. Rolling windows suit strategies meant to adapt to recent conditions only, since older data drops off. Anchored windows suit strategies that should hold across many market regimes, since all history is retained in each optimisation step.
- Does walk-forward analysis guarantee a strategy will work live?
- No. It reduces the risk of deploying a purely curve-fitted strategy, but live trading adds slippage, changing liquidity, and execution differences between brokers that no backtest, however well validated, fully captures. Always use current, real cost data from a tool like the PipTax cost audit alongside this analysis.