Home › FX Trading School › Pro
Volume & Order Flow Basics for Retail Traders
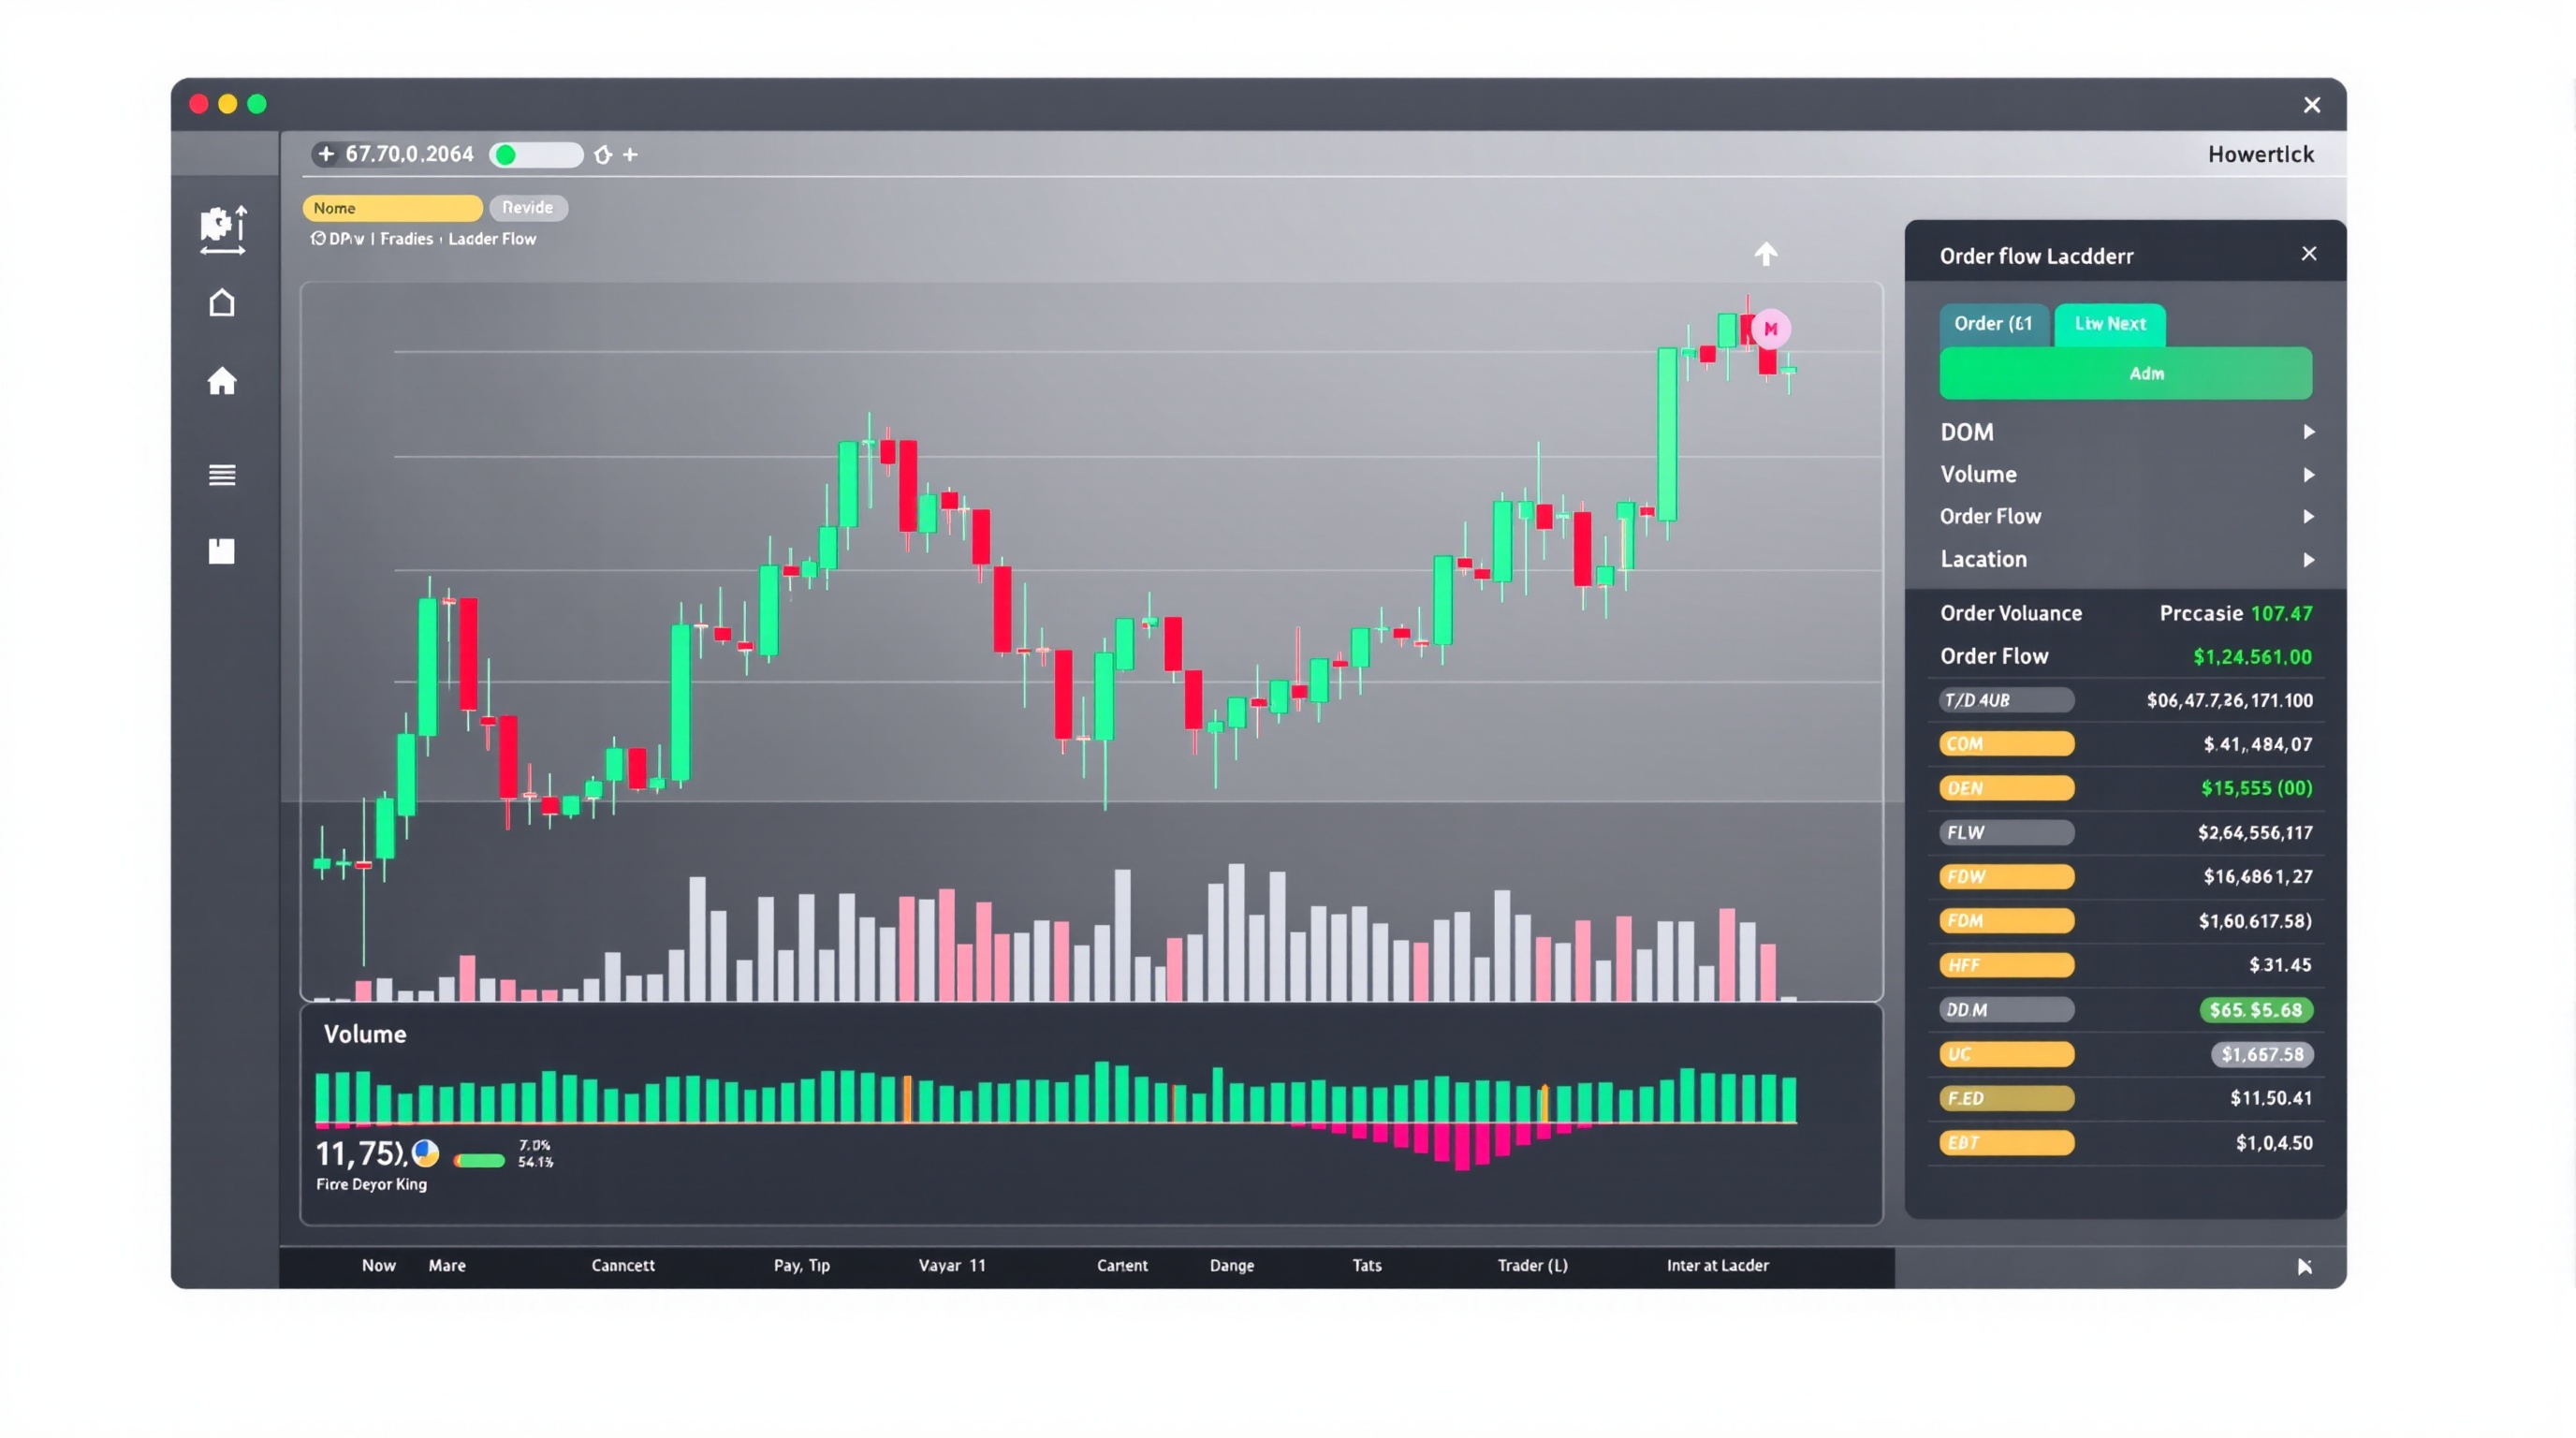
Understanding volume and order flow basics for retail traders is one of the more misunderstood parts of market structure — mostly because forex doesn't have a single, centralised tape the way stocks do. This lesson, Module 11 in the PipTax FX Trading School, builds directly on the market structure and price action groundwork from earlier modules and shows you what volume and order flow data can honestly tell you, and where it runs out of road.
What "Volume" Actually Means in Forex
Forex is an over-the-counter (OTC) market. There's no single exchange, so no single volume figure exists for "EUR/USD traded today." What you see on your charting platform is one of two things:
- Tick volume — a count of how many times the price changed within a candle. This is what MT4 and MT5 show by default.
- Broker/feed volume — the actual size processed through that specific broker's or liquidity provider's servers, where available.
Neither is the "whole market." Pepperstone's MetaTrader servers, for example, will show tick or feed volume reflecting Pepperstone's own liquidity connections — not global FX turnover. IG's own platform aggregates its own client and liquidity flow, which again is a slice, not the whole picture.
Practical takeaway: treat retail volume as a proxy for participation and interest, not a precise measure of total traded size. It's still useful — rising tick volume on a breakout genuinely does suggest more people are engaging with that move — but don't quote it as if it were NYSE-style consolidated volume.
Reading Volume Alongside Price Action
Volume on its own tells you very little. Paired with price structure, it becomes a useful filter:
- Breakout + rising volume = more conviction behind the move; worth taking seriously.
- Breakout + flat/falling volume = weak participation; higher chance of a false break or reversal.
- Trend continuation + steady volume = healthy trend.
- Trend continuation + fading volume = possible exhaustion, watch for a change in structure.
A simple exercise: pull up a recent swing high or low on a major pair and check what tick volume was doing as price approached and broke that level. You'll often see genuine breaks accompanied by a volume spike, and failed breaks ("fakeouts") on noticeably thinner bars.
This is exactly the kind of confirmation tool that pairs well with the support/resistance and swing high/low concepts from earlier in this course — volume doesn't replace structure, it adds a layer of confidence (or doubt) to structure you've already identified.
Order Flow: What the DOM and Footprint Charts Show
Order flow analysis goes a level deeper than volume bars. It looks at the actual orders sitting in, and executing against, the order book:
- Depth of Market (DOM) — shows resting buy and sell orders at each price level, giving a sense of where liquidity is stacked.
- Footprint charts — break down volume traded at each price within a candle, showing whether buyers or sellers were more aggressive.
- Time & Sales — a running log of executed trades, size, and direction.
For retail traders, the important caveat is the same as with volume: you're seeing your broker's/feed's order book, not the interbank market's. A large resting order on Pepperstone's feed doesn't mean the same size exists on IG's book, or on the wider interbank network. Order flow tools are genuinely useful for gauging short-term pressure and reaction at key levels, but they are a local view, not a global one.
Tools and Where to Access Them
Most standard retail platforms (MT4/MT5, IG's own platform) show basic tick volume by default. Genuine order flow tools — DOM ladders, footprint charts — usually require:
- A broker offering direct market access (DMA) or a professional-grade platform add-on
- Third-party charting software with a data feed connected to your broker
- Sometimes an additional subscription cost
Before paying for any of this, work out whether it will actually change your decision-making. Many traders get real value from simple tick-volume confirmation and never need a footprint chart. If you do want to go further:
1. Check what your current broker supports natively — look at the platform list on the brokers page. 2. Compare the all-in cost of any upgraded feed against your average trade size and frequency. 3. Run the numbers through the PipTax cost tool so any extra data cost is weighed against realistic trading volume, not guesswork.
Common Mistakes to Avoid
- Treating tick volume as traded size. It's a proxy, not a precise count.
- Reading order flow in isolation. A big bid stack means nothing without context — trend, structure, session, news.
- Ignoring the spread and cost side. A "textbook" order-flow entry can still be unprofitable after realistic spread and commission — always factor in your true trading costs, which you can check broker-by-broker via the PipTax cost tool.
- Assuming one broker's order flow equals the market's. Different liquidity providers, different books, different signals.
- Overfitting to a handful of examples. Volume and order flow patterns need testing across many sessions and pairs before you trust them with real risk.
Building This Into Your Trading Plan
Volume and order flow basics for retail traders should sit as a confirmation layer, not a standalone strategy. A sensible way to fold it in:
- Identify structure first (swing highs/lows, support/resistance, trend direction).
- Use volume to confirm or question breakouts and continuations.
- Use order flow/DOM data, if available, for short-term timing at key levels — not for predicting direction days in advance.
- Always size positions and set stops based on your risk plan, independent of how "convincing" the volume looks.
Practise this on a demo account first. Reading volume and order flow takes real screen time to get a feel for, and even experienced traders get it wrong regularly — remember that trading carries genuine risk of loss, and most retail accounts lose money over time. This module is about giving you an honest, workable lens on volume and order flow — not a shortcut.
Key Terms Recap
| Term | What it shows | Retail limitation | |---|---|---| | Tick volume | Count of price changes per bar | Not a true size measure | | Feed/broker volume | Size processed by your broker | Only that broker's flow | | DOM | Resting orders at each price | Only that feed's book | | Footprint chart | Buy/sell aggression within a bar | Needs add-on tools, still local view |
Use this table as a quick reference whenever you're deciding how much weight to put on a volume or order-flow signal before your next trade.
Key takeaways
- Retail forex volume is broker/tick volume, not true centralised exchange volume — treat it as a participation proxy, not gospel
- Volume confirms or questions price action: strong moves on rising volume are more trustworthy than moves on thin volume
- Order flow tools (DOM, footprint charts) show resting and executed orders but only for the liquidity your broker or feed can see
- Combine volume with market structure — support/resistance, swing highs/lows — rather than trading volume in isolation
- Spreads and commissions distort how order-flow signals translate into real edge, so check true costs via the PipTax cost tool before acting
- Practise on a demo first; order flow reading takes screen time and still won't guarantee profit — most retail accounts lose money
Frequently asked questions
- Is forex volume the same as stock market volume?
- No. Forex is decentralised, so there is no single exchange tape. What you see on MT4/MT5 or IG's platform is tick volume (a count of price changes) or, at best, the volume your specific broker or liquidity provider processed. It's a useful proxy for activity, not a complete picture of the global market.
- Can I trust order flow (DOM) data from a retail broker?
- It shows real orders, but only within that broker's or feed's visible liquidity pool. Pepperstone's MetaTrader servers, for instance, reflect the orders routed through Pepperstone's own liquidity, not every order in the global FX market. Treat it as a local, honest snapshot rather than the full market.
- What's the difference between tick volume and real volume?
- Tick volume counts how many times the price changed in a period. Real (traded) volume counts the actual size traded. Retail FX platforms almost always show tick volume, which correlates reasonably well with activity but isn't a precise measure of size.
- Do I need special software for order flow trading?
- Footprint charts and detailed DOM analysis usually need add-on platforms or data feeds beyond standard MT4/MT5. Some brokers offer this through partner platforms; check what's available on your broker's platform list, and compare costs via the PipTax cost tool before paying for extra data.
- How much should a beginner rely on volume and order flow?
- As a supporting confirmation tool, not a standalone system. Build your foundation in market structure and price action first (see earlier modules), then layer volume and order flow on top as a confidence filter.