Home › FX Trading School › Advanced
Volatility Modelling for Position Sizing
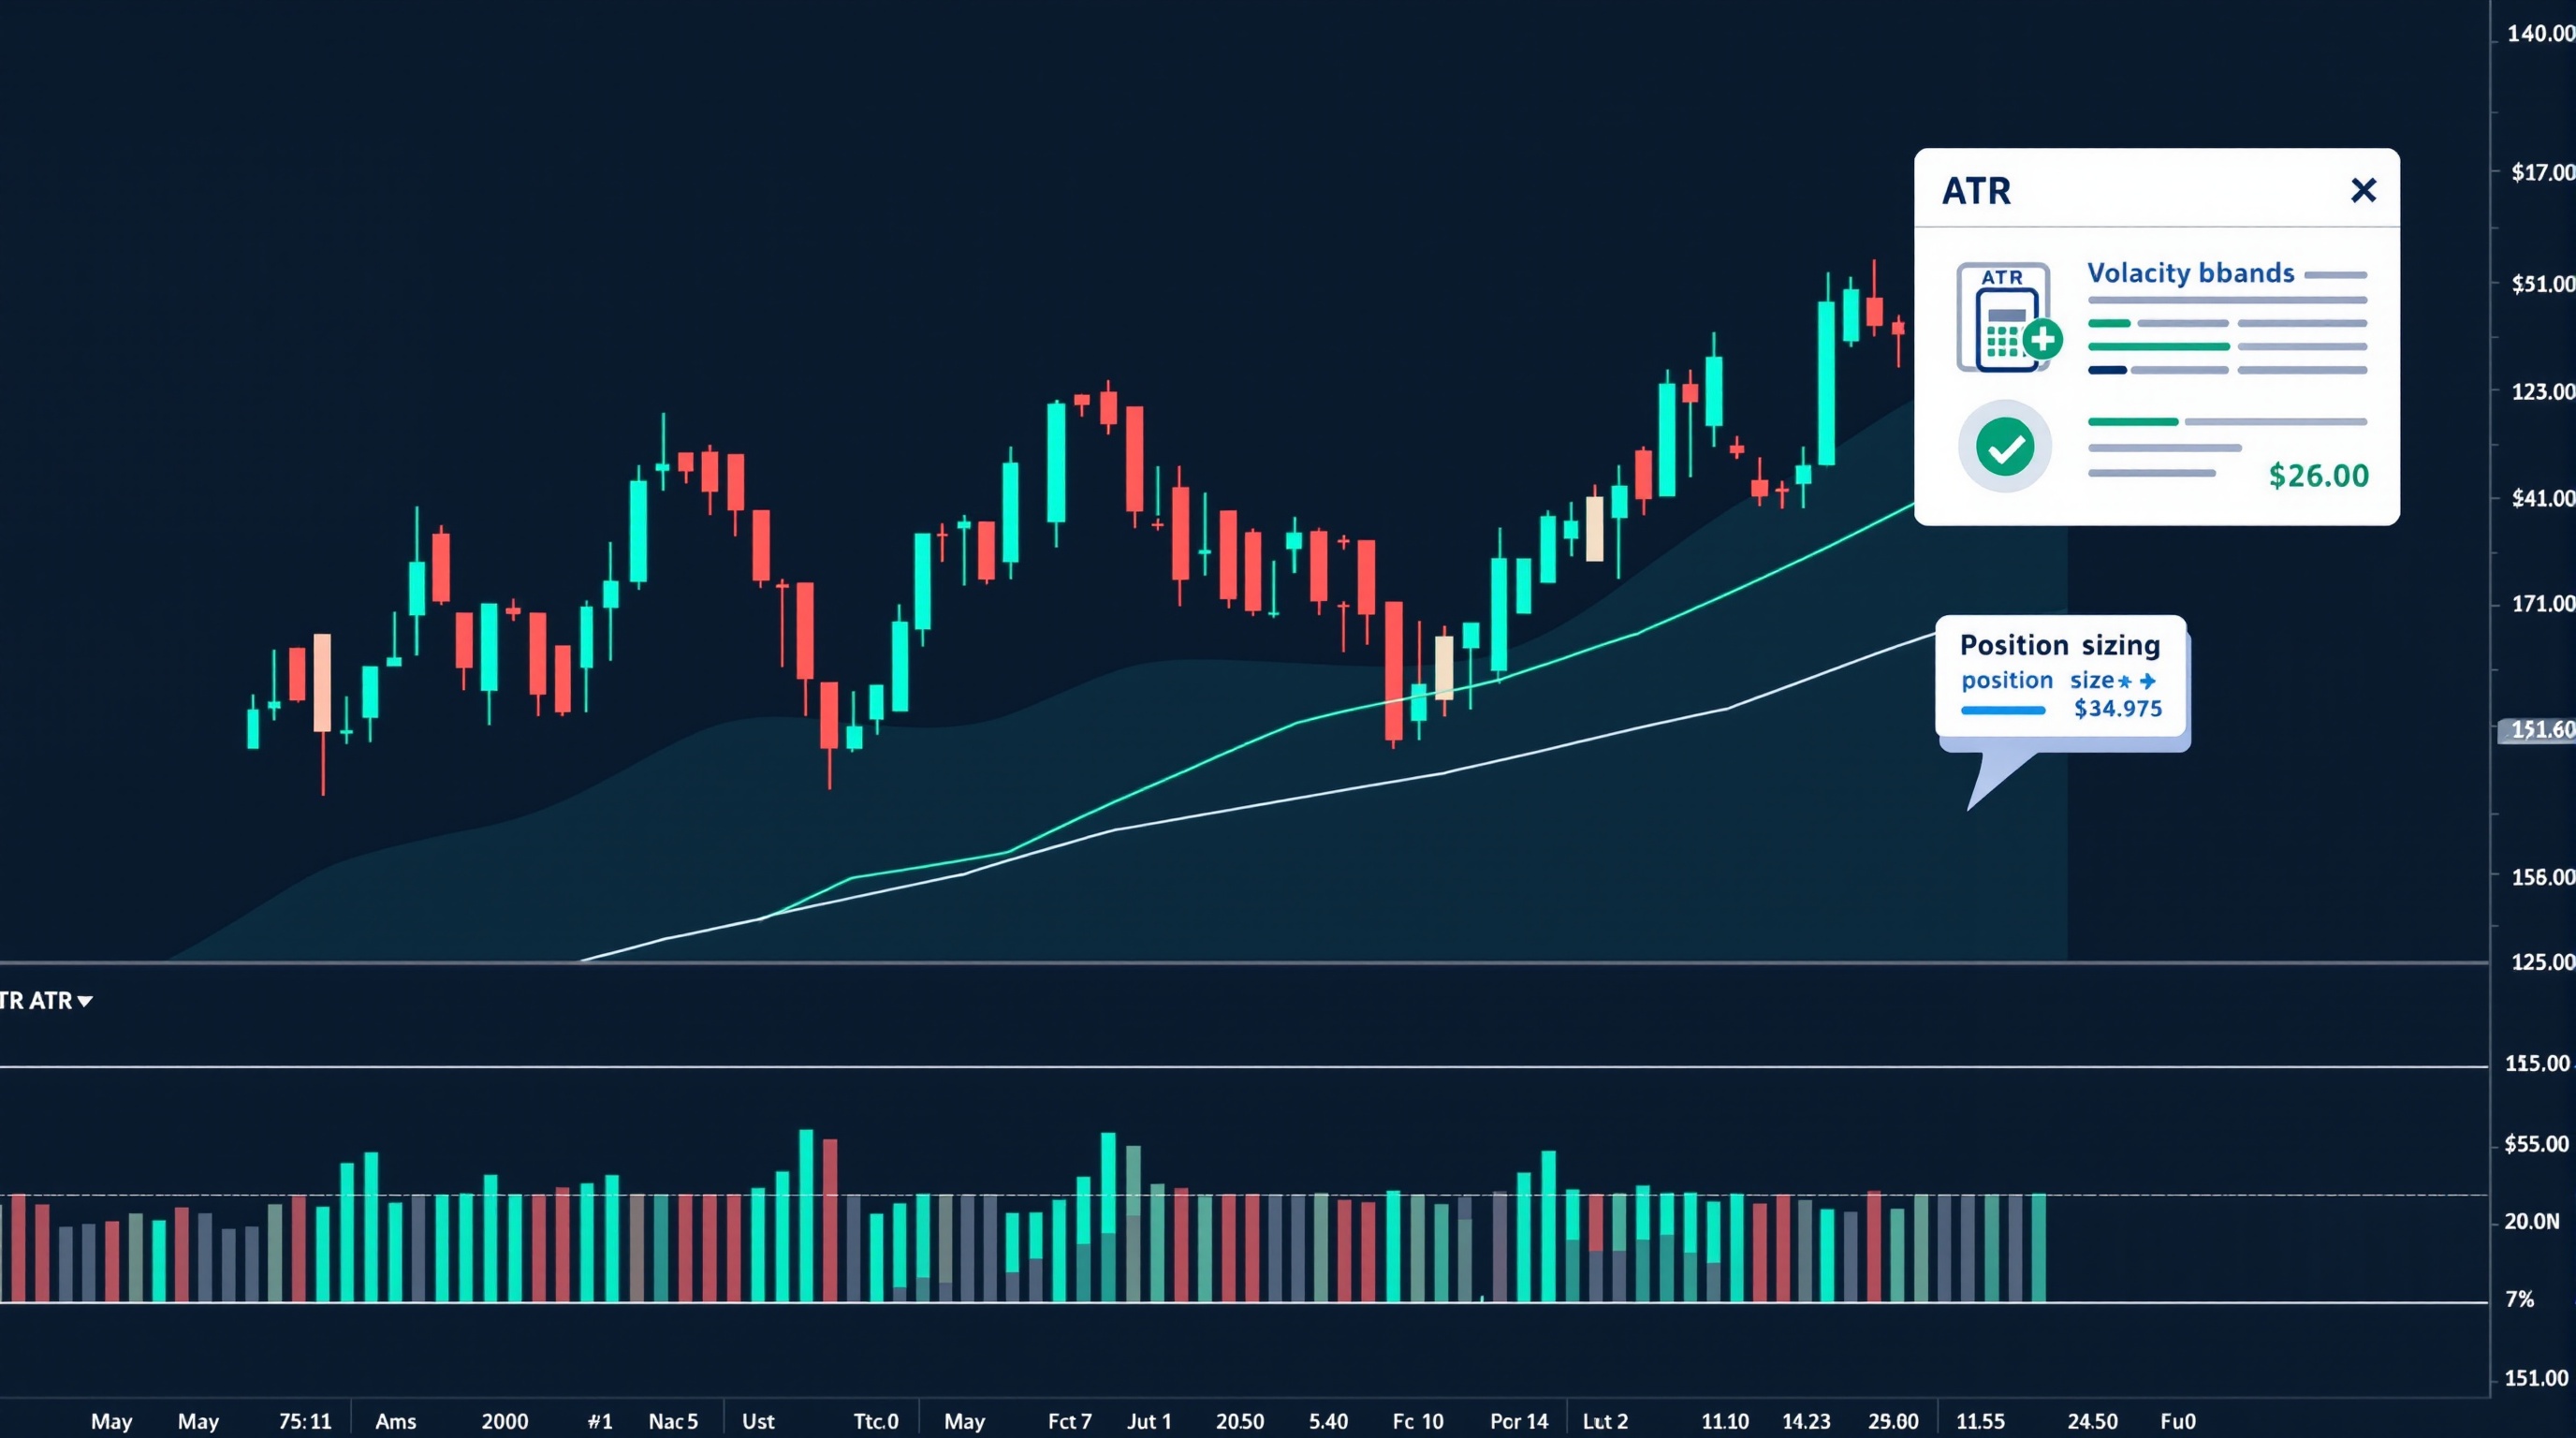
Volatility modelling for position sizing is the practice of setting your trade size based on how much an instrument is actually moving right now, rather than using a fixed lot size or a fixed pip stop regardless of market conditions. This lesson assumes you've already covered fixed-fractional risk sizing and basic stop placement earlier in the course — here we refine both by making the stop and the size respond to measured volatility.
Why fixed stops break down
A fixed 20-pip stop on GBP/USD might be sensible in a quiet week and reckless during a high-impact data release. The problem with static stops and static lot sizes is that they ignore the fact that volatility is not constant — it expands and contracts in regimes.
Consequences of ignoring this:
- Oversized risk in calm markets — a stop set too wide for actual conditions ties up unnecessary margin and risks more than intended if hit.
- Undersized stops in volatile markets — a fixed pip stop gets clipped by normal noise, generating false stop-outs.
- Inconsistent risk per trade — your account risk drifts trade to trade even if your percentage-risk rule looks consistent on paper.
Volatility modelling fixes this by anchoring the stop distance — and therefore the position size — to a measured unit of typical price movement for that instrument, at that time.
The two common volatility measures
Most systematic FX traders choose between two measures. Neither is "correct" universally — pick one, understand its assumptions, and apply it consistently.
| Measure | What it captures | Typical use | |---|---|---| | ATR (Average True Range) | Average bar-to-bar range including gaps | Direct stop-distance proxy, per instrument | | Standard deviation | Dispersion of returns around a mean | Portfolio-level risk, correlation-aware sizing |
ATR is the simpler starting point for single-instrument sizing because it outputs a number in price terms (e.g. pips) that you can plug straight into a stop calculation. Standard deviation is more useful once you're combining multiple positions and need to understand how volatility across pairs interacts — a topic for a later module on portfolio-level risk.
For this lesson we'll build the workflow around ATR, since it's the most actionable for position sizing decisions made trade-by-trade.
Building the position sizing formula
The core workflow has four steps:
1. Measure current volatility. Calculate ATR over a rolling lookback (commonly 14 periods, though 20 is also used) on your chosen timeframe. 2. Set your stop as a multiple of ATR. A common starting point is 1.5× to 2× ATR, placed beyond the current range so normal noise doesn't trigger it. 3. Decide your risk per trade in account currency. For example, 1% of account equity — a figure you should already be comfortable with from the fixed-fractional sizing lesson. 4. Solve for position size.
The formula:
`
Position size = (Account risk in currency) ÷ (Stop distance in pips × pip value)
`
Where stop distance = ATR × your chosen multiple.
Worked example (illustrative numbers only):
- Account equity: £10,000
- Risk per trade: 1% = £100
- 14-period ATR on EUR/USD (1H chart): 18 pips
- Stop multiple: 1.5× → stop distance = 27 pips
- Pip value (standard lot, EUR/USD): ~£8 (varies by account currency and broker)
- Position size = £100 ÷ (27 × £8 per pip per lot) ≈ 0.46 lots
The arithmetic is simple; the discipline is recalculating ATR and re-running this formula on every new signal, not setting it once and forgetting it.
Regime shifts and recalibration
Volatility is not stationary — it clusters and shifts. A model calibrated during a quiet summer period will size positions too large once volatility expands around a central bank decision or unexpected news. Watch for:
- Sudden ATR jumps — if your rolling ATR doubles within a few sessions, your existing open-position sizing was set for a different regime.
- Volatility compression before expansion — very low ATR readings can precede sharp breakouts; some traders widen their multiple defensively during unusually quiet periods rather than tightening it.
- Session-dependent volatility — London and New York overlap typically show different ranges than the Asian session; a single daily ATR figure can mask this if you trade multiple sessions.
Practical recalibration habit: recompute ATR at the point of every new signal using a rolling window, and review monthly whether your realised stop-outs and realised volatility still match your model's assumptions.
Costs still count
A volatility model tells you how much to risk and how big to size — it says nothing about execution cost, and cost is not optional. Spread, commission and swap all reduce the effective risk budget you calculated:
- A wider spread effectively extends your stop distance beyond what you modelled.
- Commission-based accounts add a fixed cost per lot that scales with your position size — the bigger your volatility-driven size, the bigger the commission drag.
- Overnight swap matters if your stop and volatility multiple imply holding through rollover.
These figures vary by broker, account type and instrument, and they change over time — never assume last month's numbers still hold. Check current spreads and commissions on your account type using PipTax's cost tool at /audit.html before finalising size, and compare account structures on the brokers page at /brokers/index.html. For example, Pepperstone's MetaTrader servers and IG's own platform present cost information differently, so the same volatility model can produce a different net-of-cost outcome depending on where you execute — always verify live, don't assume.
Common mistakes to avoid
- Reusing one pair's ATR for another pair. GBP/JPY and EUR/CHF behave nothing alike; calculate volatility per instrument.
- Ignoring timeframe mismatch. An ATR calculated on the daily chart shouldn't set stops for a 15-minute strategy.
- Treating the model as a guarantee. Volatility modelling for position sizing manages intended risk — it doesn't prevent slippage, gaps through stops, or losses exceeding plan during fast markets.
- Forgetting to update pip value. Pip value shifts with account currency and lot size; a stale figure quietly distorts your size calculation.
- Skipping recalibration. A model set once and never revisited drifts out of step with current conditions.
Bringing it together
Volatility modelling for position sizing turns a static risk rule into one that adapts to real market conditions — it uses ATR (or standard deviation for portfolio work) to set a sensible stop distance, then sizes the trade so your intended risk per trade stays consistent across changing volatility regimes. It builds directly on the fixed-fractional sizing and stop-placement concepts from earlier in the course, and it should always be checked against live execution costs, not theoretical ones. For the underlying methodology behind PipTax's cost comparisons, see /methodology.html, and for related lessons in this course, browse /school/index.html. Trading carries genuine risk of loss regardless of how carefully a model is built — sizing discipline reduces variance, it doesn't remove risk.
Key takeaways
- Volatility modelling for position sizing means sizing trades off a measured volatility unit (like ATR) instead of a fixed lot size or fixed pip stop
- ATR and standard deviation are the two most common volatility measures; both need a consistent lookback period and instrument-specific calibration
- A fixed percentage risk per trade only works if the stop distance scales with current volatility, otherwise risk per trade drifts silently
- Volatility regimes shift — a model calibrated in a quiet market will oversize positions when volatility expands, so periodic recalibration matters
- Spreads, swaps and commissions eat into the risk budget you've calculated, so always check live costs via the cost tool before finalising size
- This builds on fixed-fractional position sizing and stop-placement logic covered earlier in the course — volatility modelling refines both
Frequently asked questions
- What's the difference between ATR and standard deviation for position sizing?
- ATR (Average True Range) measures average bar-to-bar range including gaps, so it's a direct proxy for typical price movement and translates neatly into a stop distance. Standard deviation measures dispersion of returns around a mean, which is more common in portfolio-level risk models. For single-instrument stop and size decisions, most retail systematic traders use ATR because it maps directly onto price, not returns.
- How often should I recalibrate my volatility model?
- There's no universal answer, but a common practical approach is to recalculate your ATR or standard deviation figure on every new trade signal using a rolling lookback (e.g. 14 or 20 periods), rather than setting it once and leaving it. For discretionary review, check monthly whether your realised volatility has drifted meaningfully from your model's assumptions, especially around news-heavy periods.
- Does volatility-based sizing guarantee consistent risk per trade?
- No. It aims to keep the intended risk (stop distance times position size) roughly constant in currency terms, but it doesn't account for slippage, gapping through stops, or execution costs. It's a discipline tool, not a guarantee — trading remains risky and losses can exceed the modelled amount, particularly in fast markets.
- Can I use the same volatility model across different currency pairs?
- Not directly. Each pair has its own typical range, pip value and behaviour — GBP/JPY and EUR/CHF do not move the same way. You need to calculate ATR (or your chosen measure) separately per instrument and recompute position size per instrument; never reuse one pair's volatility figure for another.
- Do broker execution costs affect volatility-based position sizing?
- Yes. Spread and commission effectively widen your realised stop distance or eat into the risk budget you calculated. Always check current costs on your specific account type via the cost tool before finalising size, since these figures vary by broker and shift over time.