Home › FX Trading School › Intermediate
Support and Resistance Explained (Module 6)
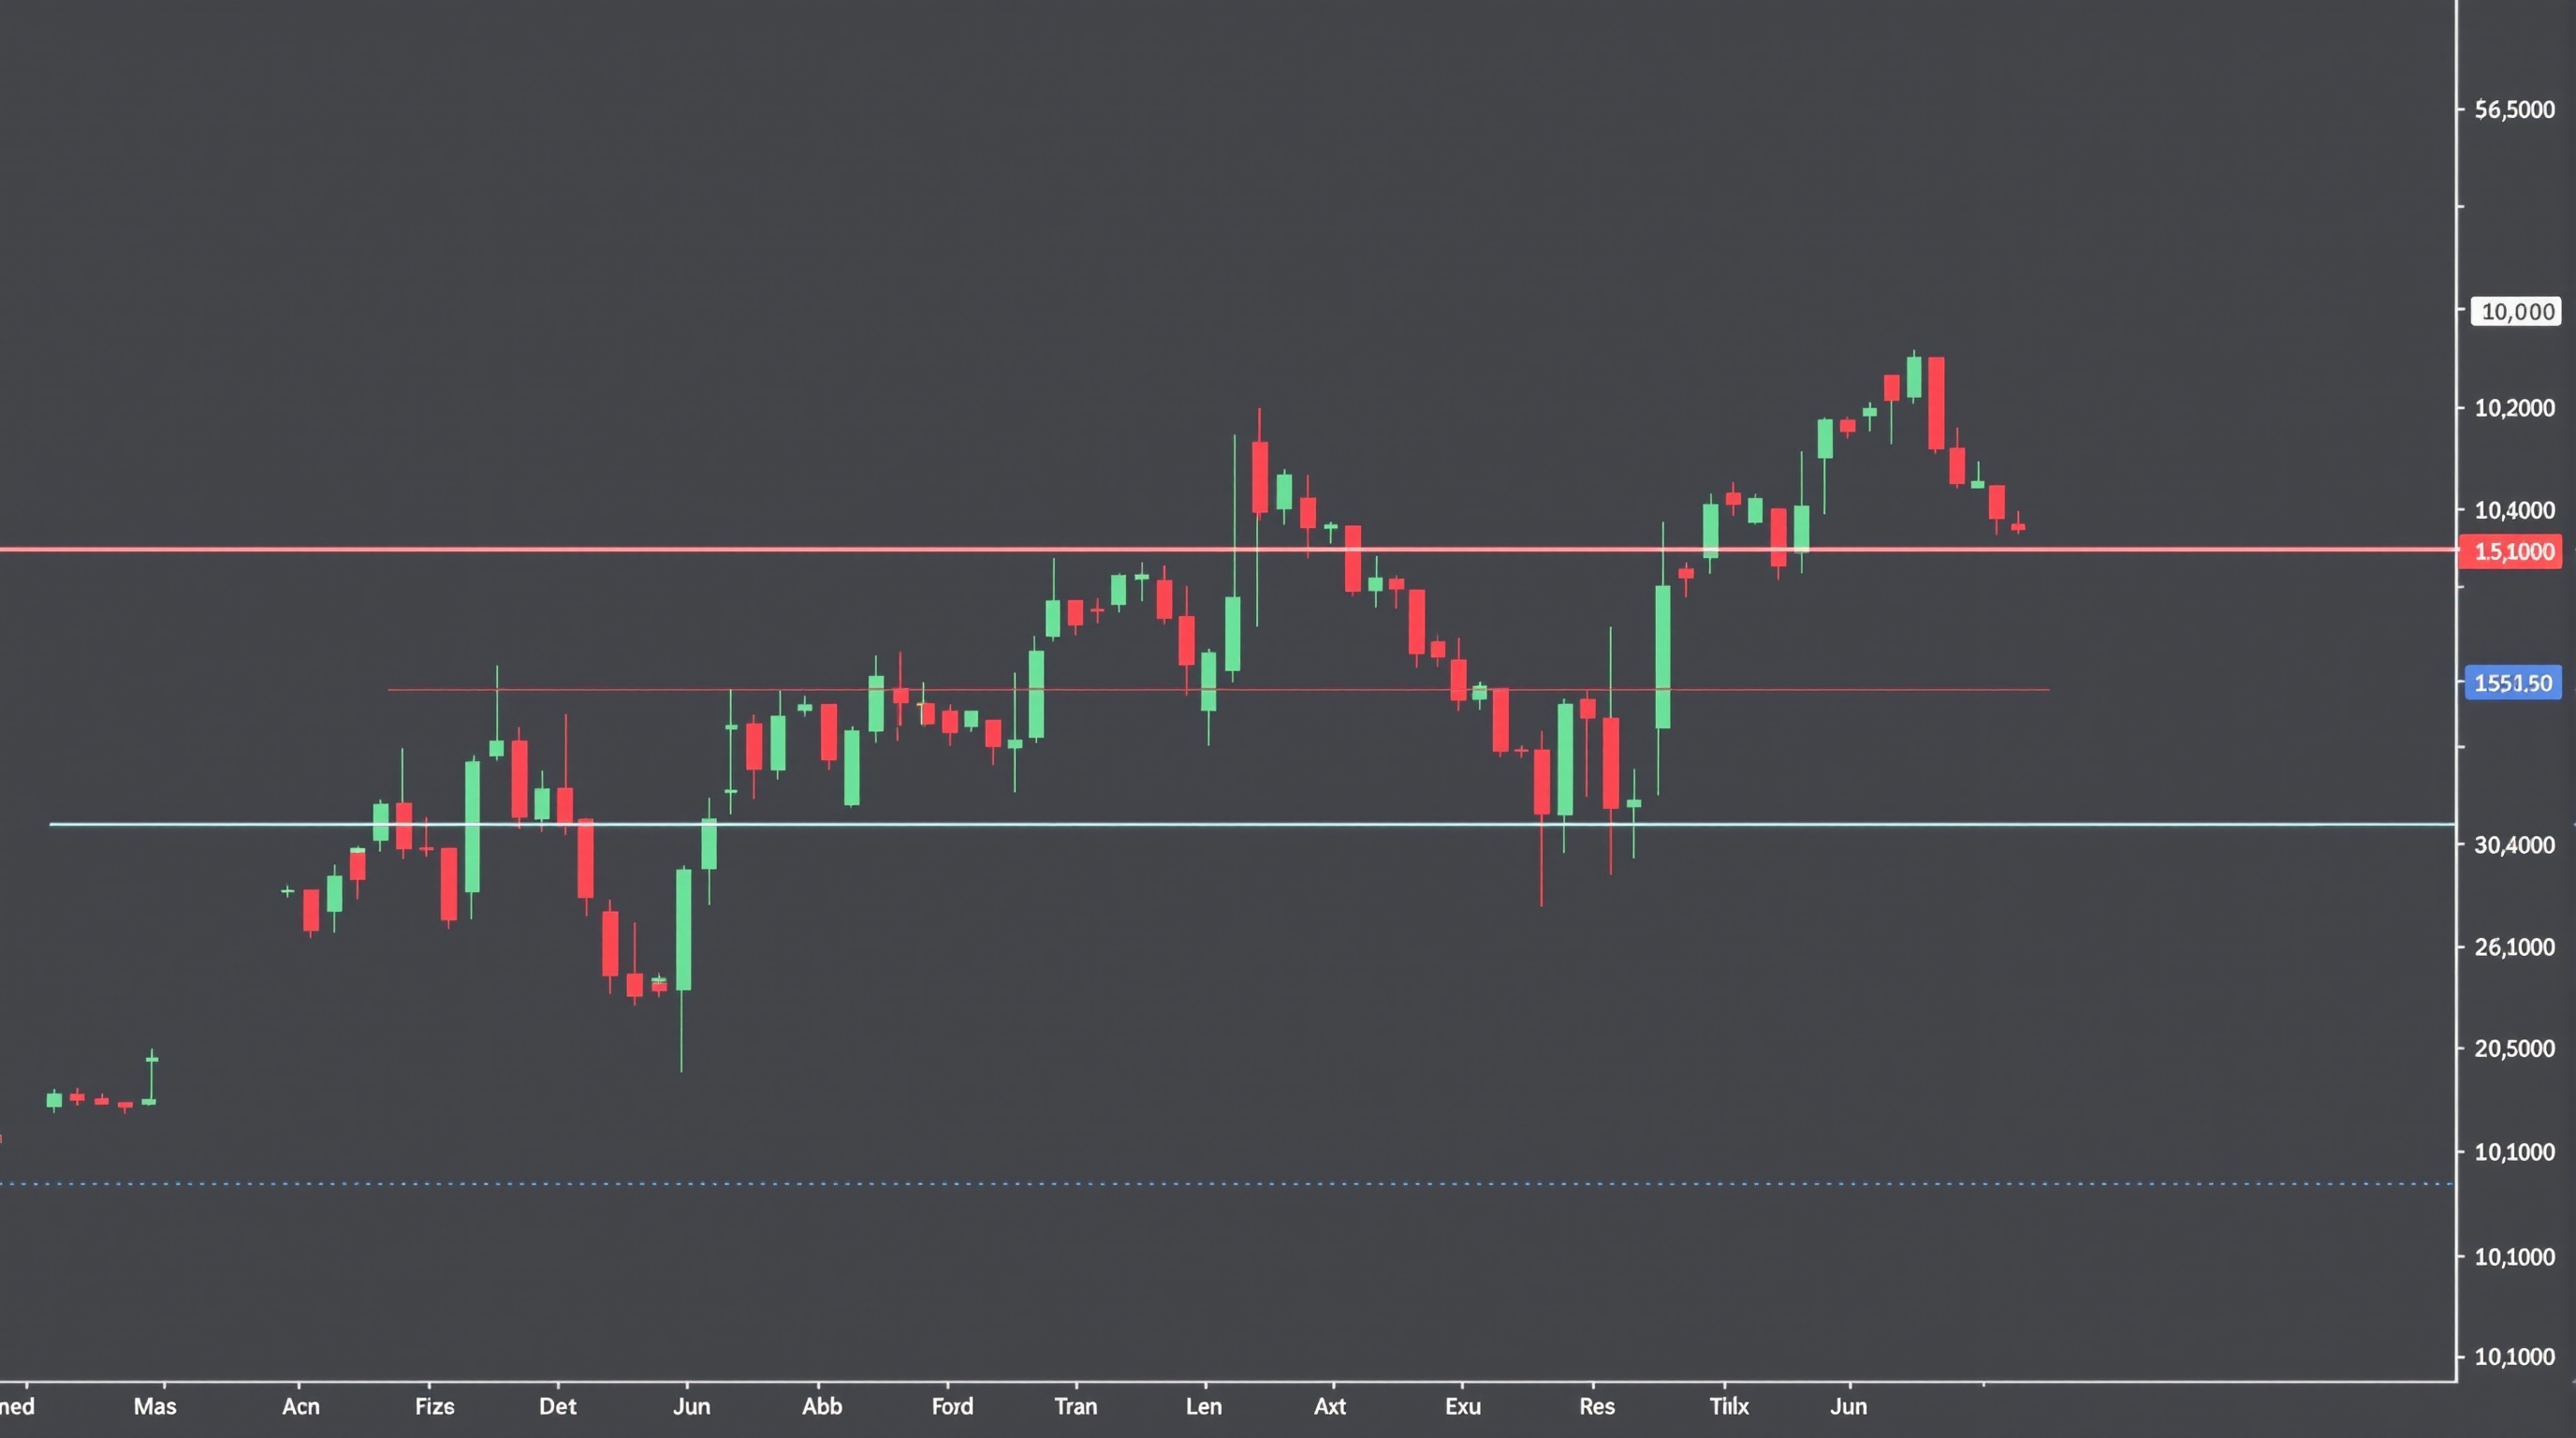
Support and resistance explained simply: it's the idea that price tends to pause, reverse, or accelerate at certain horizontal levels because that's where a large cluster of buyers and sellers previously agreed on value. This lesson builds on Module 6's earlier concept of trend identification — once you know the direction of the market, support and resistance tell you *where* on that trend to actually pay attention.
This is an intermediate lesson, so we'll assume you already know how to read a candlestick chart and can spot a basic uptrend or downtrend. If either of those feels shaky, go back to the earlier modules in the [FX Trading School](/school/index.html) before continuing.
What Support and Resistance Actually Are
Support is a price area where buying pressure has historically been strong enough to stop a decline. Resistance is the opposite — an area where selling pressure has capped an advance. Neither is a single exact price; think of them as zones, not lines, because:
- Different traders draw slightly different levels depending on whether they use wicks or closes.
- Liquidity providers and brokers may show marginally different prices at the same instant.
- Round numbers (like 1.1000 on EUR/USD) often act as psychological zones rather than precise lines.
Key characteristics of a genuine level:
- It's been tested more than once. A single touch isn't a level, it's a coincidence.
- It aligns with other evidence — a prior swing high/low, a round number, or a moving average.
- Volume or momentum often shifts noticeably as price approaches it.
Support and resistance flip roles over time. Old resistance that gets broken convincingly often becomes new support, and vice versa — this is one of the most reliable patterns in technical analysis forex traders rely on.
How to Draw Levels Without Fooling Yourself
The biggest mistake at this stage isn't misunderstanding the theory — it's drawing too many lines and finding "levels" everywhere, which is really just confirmation bias with a ruler.
A disciplined approach:
1. Start on the higher timeframe. Mark obvious swing highs/lows on the daily chart first. 2. Use closes, not just wicks, for your primary lines — wicks show intraday extremes but closes show where the market actually settled. 3. Limit yourself to 3–5 levels per chart. If you've got ten lines, none of them mean anything. 4. Re-check weekly. Markets evolve; a level ignored for months can suddenly matter again.
Avoid drawing a level, then bending the rules of "how close counts" every time price nearly touches it. If you find yourself saying "well, it basically hit it," define your zone width in advance — for example, 10–15 pips either side on a major pair — and stick to it.
Confirming a Level Before You Act On It
Spotting a level is easy. Trading it well requires confirmation, because price touching a line proves nothing on its own.
Look for:
- Rejection candles — long wicks with small bodies at the level, showing a fight and a loser.
- Slowing momentum — smaller candles as price nears the zone, suggesting exhaustion.
- Multiple timeframe agreement — the level matters more if it shows up on both the 4-hour and daily chart.
- Failed breaks — a brief poke through the level that quickly reverses, often trapping breakout traders.
None of this is a signal service or a guarantee — it's pattern recognition, and patterns fail regularly. Support and resistance levels are probabilities, not certainties, and even a textbook setup can fail because of news, low liquidity, or simple randomness.
Breakouts, Fakeouts and the Retest
A break of support or resistance is one of the most watched events in price action trading, and also one of the most misread.
Genuine breakouts tend to show:
- A strong close beyond the level, not just a brief wick through it.
- Increased range/volatility on the breakout candle.
- A retest of the broken level from the other side that holds.
Fakeouts typically show:
- A quick spike through the level followed by an immediate reversal back inside the range.
- Low follow-through — price stalls just beyond the line instead of extending.
Waiting for the retest is a common, sensible intermediate-level habit: it sacrifices some of the move for meaningfully better evidence that the break was real. It won't work every time, but it filters out a large share of impulsive fakeouts.
Why Broker Execution Changes How Levels Behave
Here's the part many courses skip: the exact price your platform shows at a level depends on your broker's data feed, and how cleanly your order fills there depends on spreads and execution model.
- On Pepperstone's MetaTrader servers, you might notice prices are quoted slightly differently between their Standard and Razor account feeds, which can shift where a level "appears" to sit by a pip or two.
- On IG's own platform, price data comes from IG's own book rather than raw MetaTrader feeds, so a level drawn on IG's chart may not line up perfectly with the same pair on a MetaTrader-based broker.
This isn't a flaw — it's just how CFD/FX pricing works across providers. Practically, it means:
- Don't treat a level as failing just because one broker's chart shows a slightly different touch than another's.
- Widen your confirmation zone rather than chasing pip-perfect precision.
- Check your own broker's real spread and execution costs with the [cost tool](/audit.html) before assuming a "failed" breakout was really a bad trade rather than just spread/slippage eating the edge.
Combining Levels With Cost Awareness
A support or resistance trade that looks good on the chart can still be a poor trade in practice if spread and commission eat too much of the expected move — especially on tighter, short-term setups.
Before placing a trade at a level, check:
| Factor | Why it matters | |---|---| | Spread at entry | A wide spread reduces effective reward on tight stops near a level | | Commission (if any) | Adds a fixed cost regardless of how clean the setup was | | Stop distance | Should sit beyond the zone, not exactly on the line, to avoid noise | | Broker execution type | Market vs instant execution affects fill quality near fast-moving levels |
None of this is broker-specific advice — costs vary by account type and change over time, so always check current figures on the [broker comparison pages](/brokers/index.html) and confirm the real, current cost of any setup with the [cost impact tool](/cost-impact.html) rather than assuming yesterday's numbers still apply.
Conclusion: Making Support and Resistance Work For You
Support and resistance explained in one sentence: it's a map of where past decisions cluster, used to estimate where future decisions might cluster again — nothing more certain than that. Used with discipline — few levels, real confirmation, and awareness of broker execution and cost — it becomes one of the more durable tools in a technical trader's kit. Used carelessly, it becomes an exercise in seeing patterns that aren't really there. Practise drawing levels on a demo chart before risking real capital, and remember that even well-drawn levels fail regularly; trading carries genuine risk of loss.
Key takeaways
- Support and resistance are zones of clustered past buying/selling interest, not exact lines
- Genuine levels are tested multiple times and align across timeframes, not drawn from a single touch
- Broken resistance often becomes new support and vice versa
- Confirm levels with rejection candles, slowing momentum, or a retest before acting — don't trade the first touch
- Broker data feeds (e.g. Pepperstone MetaTrader vs IG's own platform) can shift exact price levels by a pip or two — widen your confirmation zone accordingly
- Always weigh spread, commission and stop distance against a level-based setup using the cost tool before entering
Frequently asked questions
- What's the difference between support and resistance and a trendline?
- Support and resistance are horizontal (or near-horizontal) zones based on prior price reaction, while trendlines are diagonal, connecting a series of rising or falling swing points. Both are forms of price action trading and often work well together.
- How many pips should my support/resistance zone be?
- There's no fixed rule — it depends on the pair's typical volatility and your timeframe. Many intermediate traders use roughly 10-15 pips on major pairs as a starting buffer, then adjust based on backtesting their own charts.
- Why does a level look slightly different on Pepperstone vs IG?
- Pepperstone's MetaTrader servers and IG's own platform pull from different underlying price feeds, so quotes can differ by a pip or two at any moment. This is normal across brokers and is one reason to treat levels as zones rather than exact prices.
- Can support and resistance be automated or coded into an EA?
- Yes, many expert advisors use swing high/low detection to approximate levels, though defining a 'genuine' level programmatically is harder than spotting one visually. See the Expert Advisors section of the school for more on this.
- Is trading breakouts of support and resistance reliable?
- No single method is reliable on its own. Breakouts fail often (fakeouts), which is why many traders wait for a retest of the broken level before entering, accepting a slightly later entry for better confirmation.
- Do spreads matter more for support/resistance trades than other strategies?
- They can, especially on tight stops placed just beyond a level. A wide spread can turn a technically correct read of support and resistance into a losing trade after costs, so it's worth checking real spread data before trading the setup.