Home › FX Trading School › Pro
Supply and Demand Zones in Practice (Module 11)
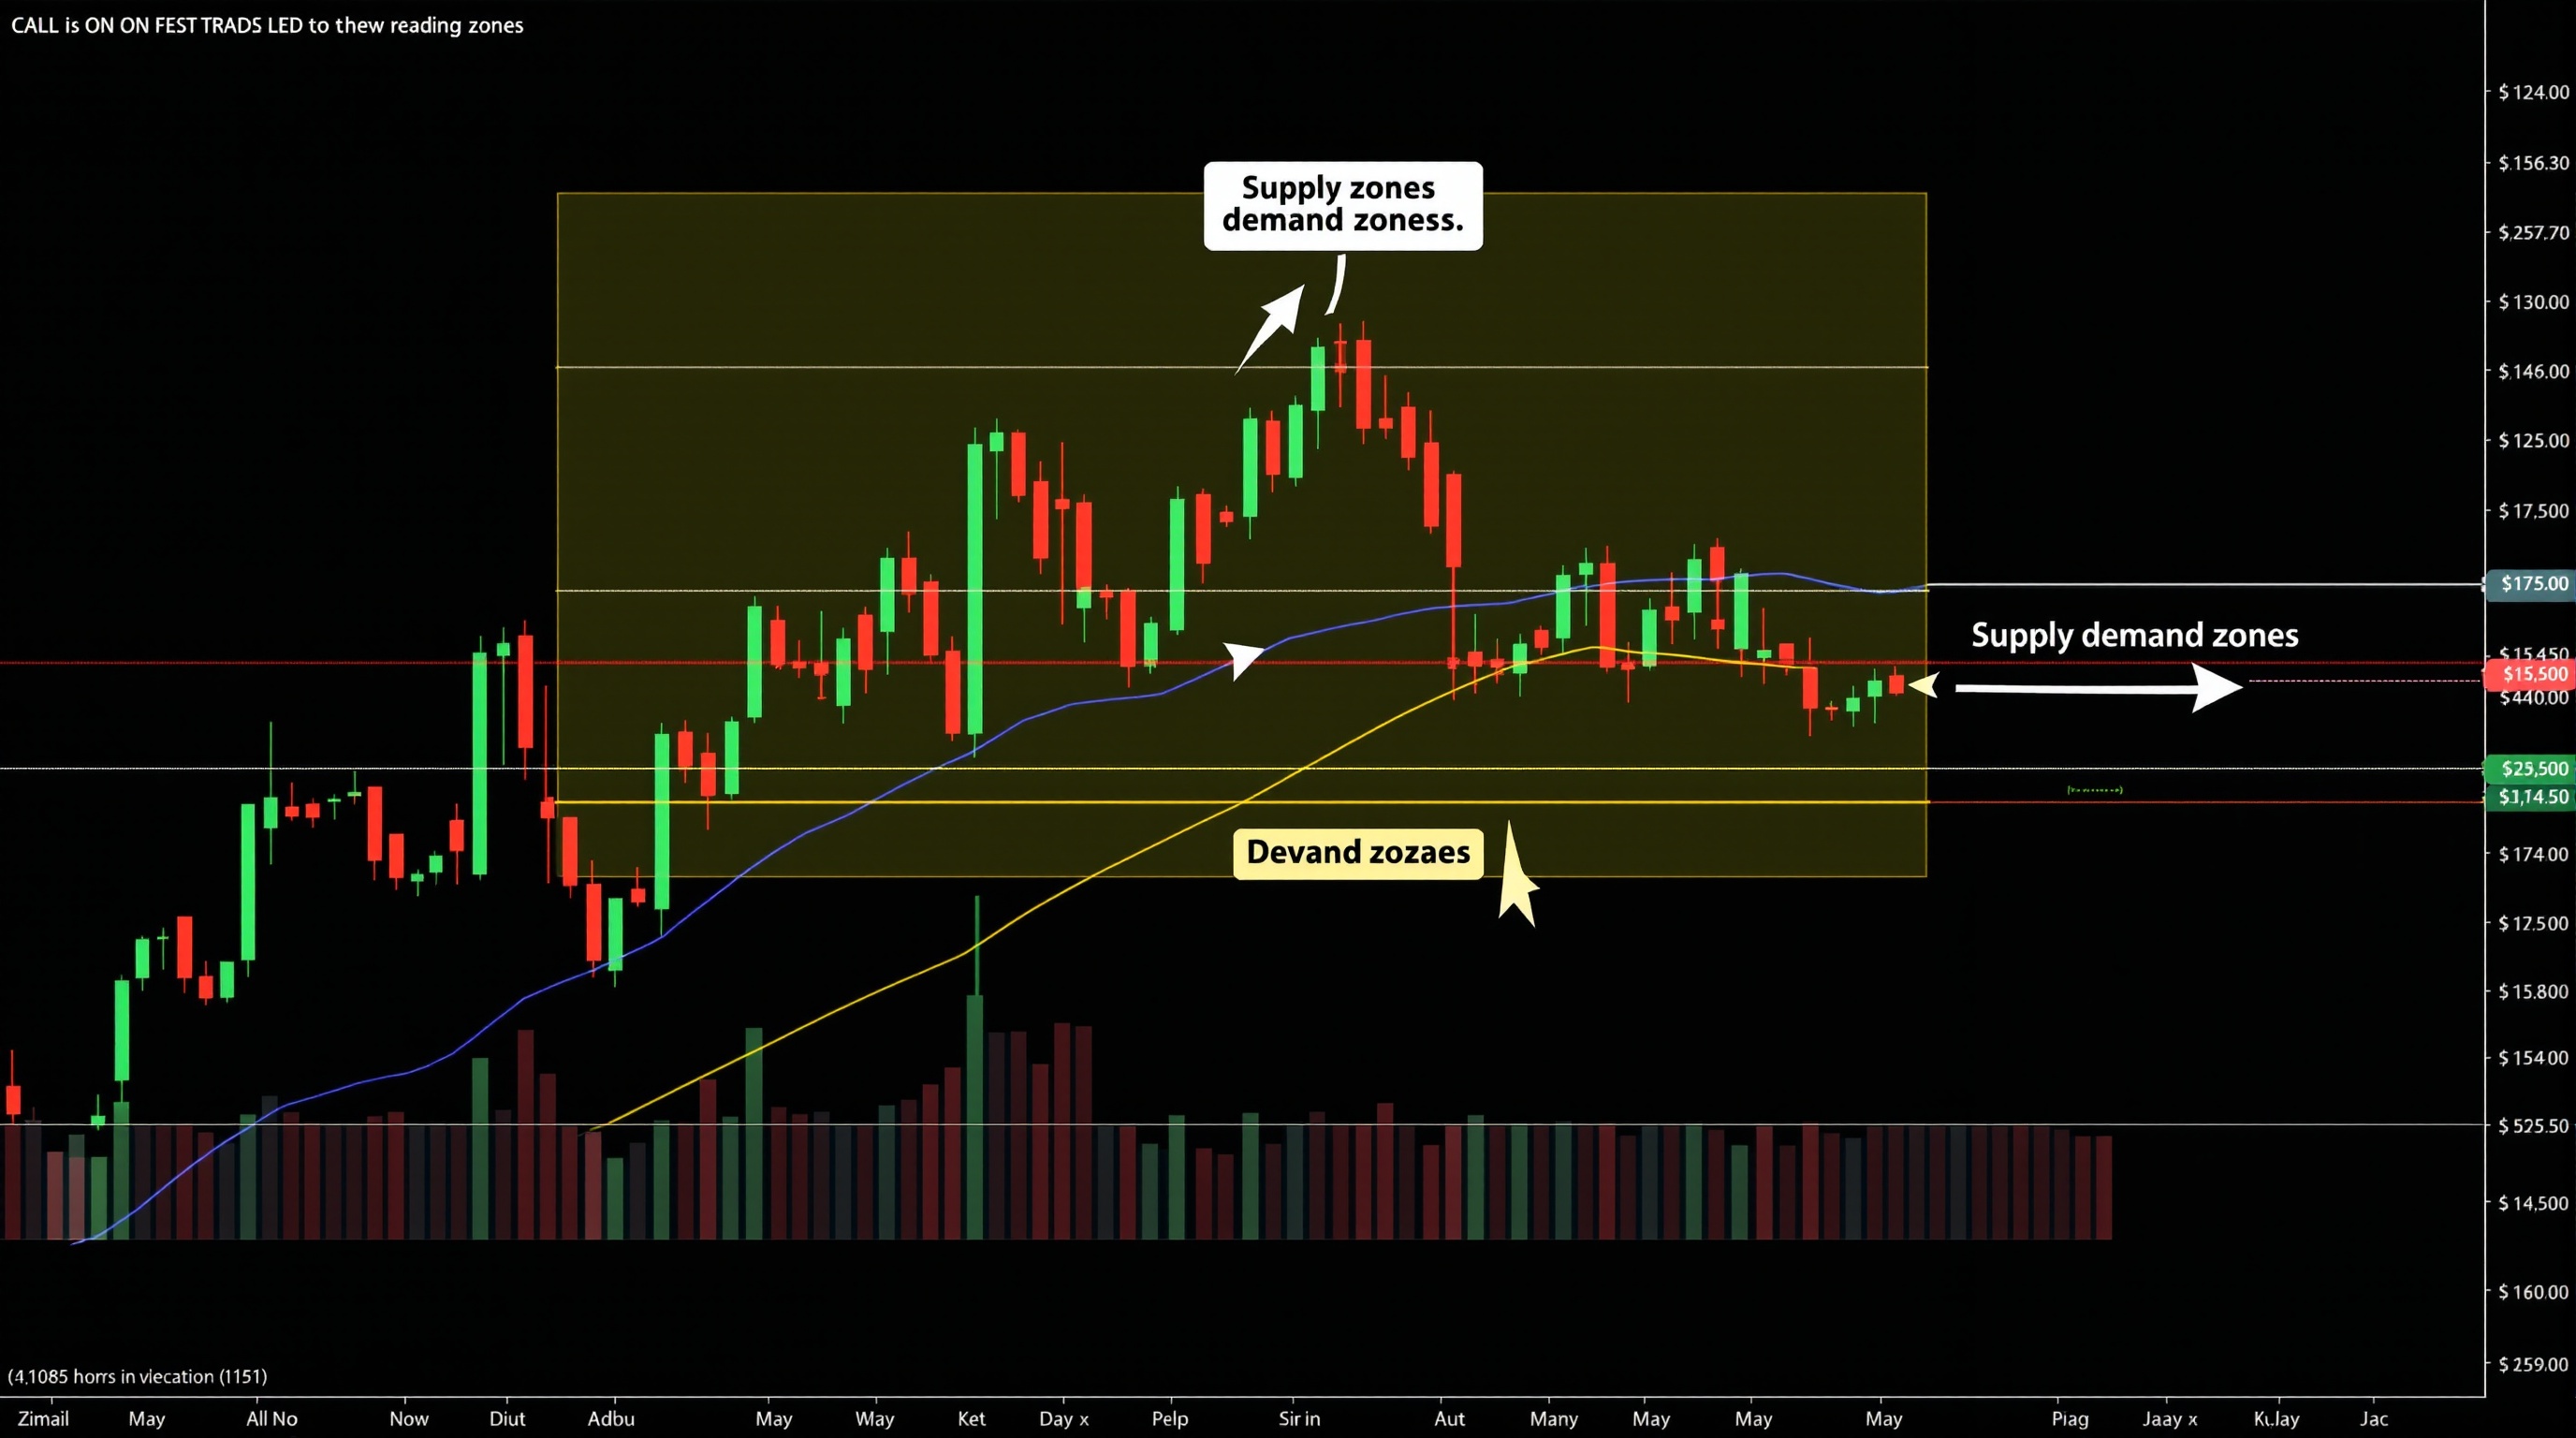
Supply and demand zones are one of the most misused ideas in retail forex trading, and this lesson exists to fix that. Used properly, they give you a structured way to find where price is likely to react — not a guaranteed reversal signal, but a probability tool that works best alongside the market structure concepts from Module 10.
This is a PRO-level lesson, so we're assuming you're already comfortable identifying swing highs and lows, trend structure, and basic risk sizing. If any of that feels shaky, go back through the earlier modules in the [FX Trading School](/school/index.html) before continuing — zone trading without solid structure underneath it is just guesswork with extra steps.
What a Supply or Demand Zone Actually Is
A zone forms where price paused, then left sharply in one direction — evidence that a large imbalance between buy and sell orders existed at that price. It is not:
- Any horizontal line you draw because price touched it twice
- A round number with no candle evidence behind it
- A zone you've already watched price blow through twice
It is:
- A base (a small consolidation, often 1–5 candles) followed by a strong, decisive move away
- An area, not a single price — mark it as a rectangle from the base's high to its low
- A record of where real orders sat, on the timeframe you're trading
Demand zones sit below price where buying overwhelmed selling. Supply zones sit above price where selling overwhelmed buying. The strength of the departure candle (its size and momentum relative to recent candles) is your first clue about how much unfilled order flow might still be sitting there.
How to Draw Zones Correctly
Consistency matters more than precision here. A repeatable method beats a "perfect" one you can't apply live.
1. Find the departure move — a candle or short sequence that leaves a level with visible momentum, ideally breaking a recent swing high or low. 2. Identify the base — the last 1–3 candles before that move, where price was consolidating. 3. Draw the zone — from the extreme wick of the base to the body edge closest to the departure. Some traders use the full wick-to-wick range; pick one convention and stay consistent. 4. Mark it on your chart and note the timeframe it came from — a 4-hour zone and a 15-minute zone are not equal in weight.
Do this on a clean chart, before price returns to test it. Drawing zones with hindsight, after you've already seen the reaction, teaches you nothing and will flatter your backtesting.
Grading Zone Quality
Not all zones deserve equal trust. Grade each one on three factors:
| Factor | Stronger zone | Weaker zone | |---|---|---| | Freshness | Never retested | Tested 2+ times already | | Departure strength | Large, momentum candle, breaks structure | Small, indecisive move | | Base tightness | Short, narrow consolidation | Long, sprawling base |
A fresh, tight, strong-departure zone on a higher timeframe is the kind of setup worth risking real size on. A wide, stale, third-time-tested zone on a 5-minute chart is not — treat it as noise or skip it entirely.
Trading the Zone: Entry, Stop and Target
Zones tell you *where* to look, not *when* to blindly enter. A common approach:
- Wait for price to return to the zone rather than chasing it there
- Look for confirmation — a rejection wick, a shift in lower-timeframe structure, or a slowdown in momentum as price enters the zone
- Place the stop just beyond the zone's outer edge, giving it room to be tested without being invalidated by minor noise
- Target the next opposing zone or structural swing point, not an arbitrary pip count
Because entries are precise and stops are often tight, execution costs matter. A few points of spread can meaningfully change your risk-reward on a small stop. This is exactly the kind of detail the [cost audit tool](/audit.html) is built for — run your instrument and account type through it before sizing a zone trade, rather than guessing.
Common Mistakes That Ruin Zone Trading
- Drawing too many zones. If every pullback becomes a "zone," you've just recreated random support and resistance with extra jargon.
- Ignoring the higher-timeframe trend. A strong demand zone in a clear downtrend is fighting the odds — Module 10's structure work should always sit above this.
- Trading stale zones. Once a zone has absorbed two or three tests, most of its original orders are gone.
- Sizing every zone trade the same. A grade-A fresh zone and a marginal C-grade zone shouldn't carry equal risk.
- Forgetting execution reality. Backtests on a clean chart don't include spread, slippage, or the fact your broker's server might fill you a pip or two worse in fast markets — differences you can compare on the [brokers page](/brokers/index.html).
Practising This on a Demo Account
Before risking real money, mark up 20–30 historical zones across a few pairs and timeframes, then track how price actually behaved at each one. Note the grade you gave beforehand and the outcome — this is how you calibrate your own judgement rather than trusting a rule blindly.
Both Pepperstone and IG offer demo environments where you can test this workflow using their real MetaTrader or platform feeds respectively — Pepperstone's MT4/MT5 servers and IG's own platform both give you realistic price action to practise zone-drawing on, without financial risk. Once you're consistent on demo, use the cost tool to understand what spread and commission will do to your specific entries before going live.
Conclusion
Supply and demand zones are a genuinely useful part of a structured trading approach, but only when you draw them consistently, grade them honestly, and combine them with the market structure and risk management covered earlier in this course. They won't make trading easy — most retail accounts still lose money, and zones are a probability edge, not a certainty. Treat every zone trade as a graded decision, check your real execution costs before entering, and keep the process the same whether the last one won or lost.
Key takeaways
- Supply and demand zones mark where large orders previously overwhelmed price, not just any consolidation area
- Fresh, untested zones with a strong departure candle carry more weight than zones price has already returned to
- Always grade a zone by the strength of the move away from it, the time spent basing, and how many times it's been retested
- Zones are a probability tool, not a certainty — combine them with market structure and proper risk sizing from earlier modules
- Spread and slippage matter more at zone edges because entries are precise; check real costs on the cost tool before sizing a trade
- Most retail accounts lose money trading zones badly defined or oversized — treat this as a discipline exercise, not a shortcut
Frequently asked questions
- What's the difference between supply and demand zones and support and resistance?
- Support and resistance are usually single lines drawn at obvious turning points. Supply and demand zones are ranges (not lines) marking where an imbalance between buyers and sellers caused a sharp move away — they're built from candle structure, not just eyeballed price levels.
- How do I know if a zone is still valid?
- A zone stays valid until price has traded through it with conviction, not just poked into it. Each time price returns and reacts, the zone weakens slightly. After two or three clean tests, treat it as used up unless there's a strong reason it might hold again.
- Should I trade every zone I find?
- No. Grade zones by freshness, the strength of the departure move, and confluence with broader market structure from Module 10. Weak, over-tested, or counter-trend zones are lower-probability and should be sized down or skipped.
- Do spreads and commissions affect zone trading more than other strategies?
- Yes, because zone entries are precise and stops are often tight relative to the zone width. A wide spread can eat a meaningful chunk of a small stop. Always check live costs on the cost tool before committing to a zone-based entry.
- Can I use supply and demand zones on any timeframe?
- Yes, but zones on higher timeframes (daily, 4-hour) tend to be more reliable than those on 1-minute or 5-minute charts, simply because more real volume and more participants were involved in creating them.