Home › FX Trading School › Intermediate
RSI Indicator Explained: A Practical Guide for FX Traders
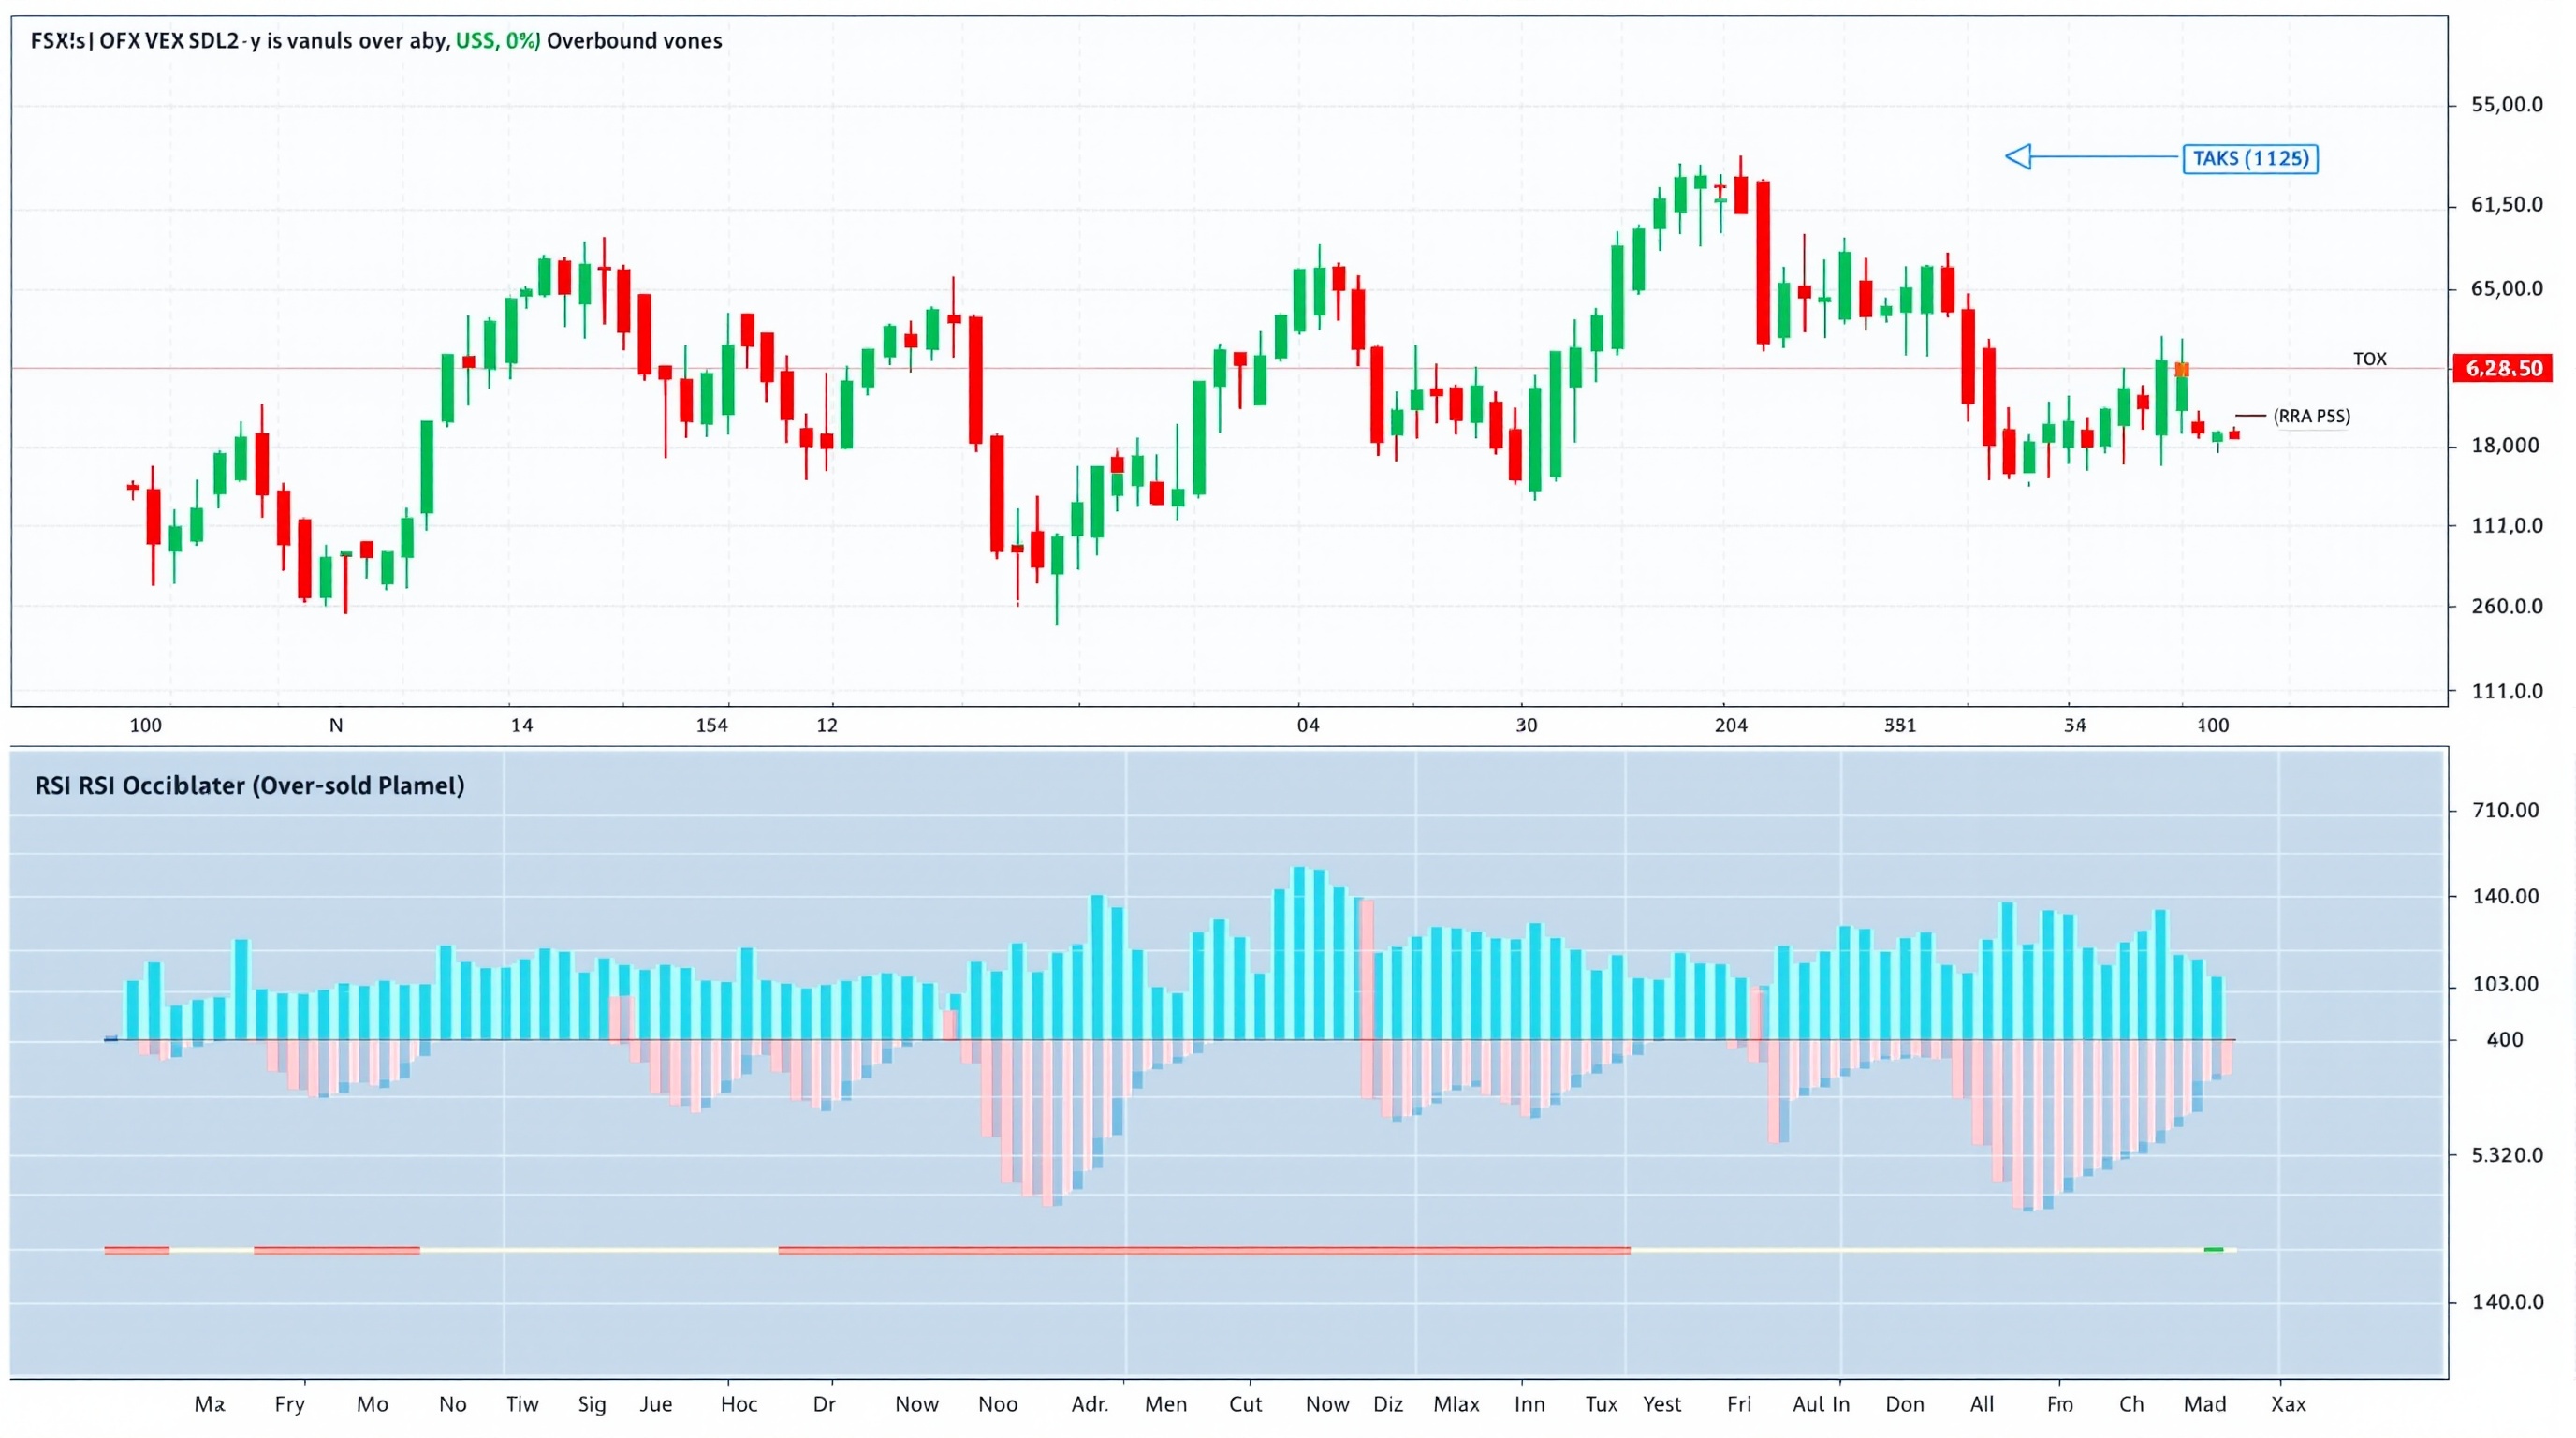
The RSI indicator — short for Relative Strength Index — is one of the most widely used momentum tools in forex trading, appearing on every major platform from MetaTrader to IG's own charting package. This lesson, part of Module 6 on technical analysis in the PipTax FX Trading School, builds on the trend and support/resistance concepts from earlier modules and shows you how to actually use RSI in a trading workflow rather than just staring at a wiggly line under your chart.
What the RSI Indicator Actually Measures
RSI was developed by J. Welles Wilder and plots a value between 0 and 100 based on the ratio of average gains to average losses over a set lookback period, usually 14 candles. The maths behind it is simpler than it looks:
- Calculate the average gain and average loss over the last 14 periods.
- Divide average gain by average loss to get the "relative strength" (RS).
- Convert RS into the 0-100 RSI scale using a standard formula.
The practical upshot: RSI tells you how strong recent buying has been compared with recent selling, on whichever timeframe you're viewing. It says nothing about *why* price moved, and nothing about news, spreads, or liquidity — it's purely a description of recent price behaviour.
Key point for intermediate traders: RSI is a lagging-but-leading hybrid. It's calculated from past price data (lagging) but is often used to anticipate exhaustion in a move (a leading use). Understanding that tension is what separates traders who use RSI sensibly from those who get whipsawed by it.
If you haven't yet covered how trends and ranges are identified using price structure, go back to the earlier Module 6 lessons before relying heavily on RSI signals — it works far better with that context.
Reading Overbought and Oversold Levels
The classic RSI reading uses two thresholds:
| RSI Level | Traditional Interpretation | |---|---| | Above 70 | Overbought — recent gains have dominated | | Below 30 | Oversold — recent losses have dominated | | Near 50 | Roughly balanced momentum |
The mistake most intermediate traders make is treating these as automatic buy/sell triggers. In a genuine trending market, RSI can sit above 70 for days or weeks while price continues climbing — the market is telling you momentum is strong, not that it's about to reverse. This is why RSI extremes are far more reliable in range-bound markets than in strong trends.
A more careful approach:
- In a range, treat 70/30 crosses as potential turning points worth investigating alongside support/resistance.
- In a trend, use RSI dipping to 40-50 (in an uptrend) or rising to 50-60 (in a downtrend) as a "reset" that often precedes the trend resuming — some traders use 40/60 as trend-continuation levels rather than 30/70.
- Never trade the level in isolation — check what price is doing at that moment first.
RSI Divergence: The More Useful Signal
Divergence is where price and RSI disagree, and it's arguably the most practical RSI-based signal for intermediate traders:
- Bearish divergence: price makes a new higher high, but RSI makes a lower high. Momentum is fading even as price pushes up.
- Bullish divergence: price makes a new lower low, but RSI makes a higher low. Selling pressure is weakening even as price falls.
Divergence doesn't mean "reverse now" — it means momentum is losing sync with price, which often (not always) precedes a slowdown or reversal. It works best:
- On higher timeframes (H4, daily) where noise is lower.
- Near an existing support/resistance level, adding confluence.
- Combined with a price-action confirmation (a rejection candle, a break of a minor trend line) before acting.
Divergence spotted in isolation on a 1-minute chart, with no other context, is a weak signal and easy to over-interpret with hindsight bias — be honest with yourself when back-testing this.
Building an RSI Workflow You Can Actually Use
A sensible intermediate-level RSI routine looks something like this:
1. Establish the higher-timeframe trend first (daily or H4) using structure, not RSI. 2. Check RSI on your trading timeframe for overbought/oversold conditions or divergence. 3. Look for confluence — a support/resistance level, a trend line, or a prior swing point lining up with the RSI signal. 4. Wait for price confirmation — don't act on RSI alone; wait for a candle close or pattern that agrees. 5. Define risk before entry — where's the stop, and does the position size respect your account risk rules?
This sequencing matters more than the indicator itself. RSI is a filter that helps you avoid low-quality setups and add confidence to good ones — it isn't a signal generator you can trade blind.
RSI Settings Across Platforms and Timeframes
The default 14-period setting is standard, but it's worth understanding your options:
- Shorter periods (7-10): more responsive, more signals, more noise — better suited to scalping on lower timeframes.
- Longer periods (21-25): smoother, fewer signals, better suited to swing trading on H4/daily charts.
- Smoothing method: most platforms default to Wilder's smoothing; some allow simple or exponential variants, which will shift readings slightly.
If you're testing this across brokers — say, MetaTrader on a Pepperstone server versus IG's own platform — expect the overall shape of RSI to match closely but individual values to differ marginally at the edges due to smoothing differences. This is normal and not a sign anything's broken; it's just a reminder that indicators are calculated, not universal truths handed down from the market itself.
Common RSI Mistakes at This Level
Watch out for these habits as you move from beginner to intermediate use of RSI:
- Trading every 70/30 cross without checking trend context — the fastest way to fight a strong trend and lose repeatedly.
- Ignoring divergence timeframe — a divergence on a 5-minute chart carries far less weight than one on a daily chart.
- Using RSI in isolation — no confluence with structure, no confirmation candle, no defined stop.
- Assuming identical readings across platforms — small smoothing differences between MetaTrader and IG's charts are expected, not a bug.
- Forgetting trading costs — a technically "correct" RSI signal can still be unprofitable after spread and commission on a low-timeframe strategy with tight targets. Run any strategy idea through PipTax's cost tool at /audit.html to see how spreads and commissions from your actual broker eat into smaller RSI-based setups, and compare providers on /brokers/index.html before assuming a strategy is viable.
Conclusion
The RSI indicator is a genuinely useful momentum tool once you understand what it's measuring and, just as importantly, what it isn't — it doesn't know about trend, structure, or cost, so it's on you to bring those to the chart. Used as a confirmation filter alongside trend and support/resistance from earlier lessons, and combined with a realistic view of trading costs via PipTax's cost tool, RSI can genuinely sharpen your decision-making. Used blindly as a standalone signal generator, it will disappoint you exactly as often as any other shortcut in trading. Trading carries real risk of loss regardless of which indicators you use, so keep position sizing and risk management central to every RSI-based decision you make.
Key takeaways
- The RSI indicator measures the speed and size of recent price moves on a 0-100 scale, using average gains versus average losses over a lookback period (14 is the default).
- Readings above 70 suggest overbought conditions and below 30 suggest oversold — but in a strong trend, RSI can stay pinned near these extremes for a long time, so don't treat them as automatic reversal signals.
- RSI divergence, where price makes a new high or low but RSI doesn't, is often a more useful signal than the raw overbought/oversold levels alone.
- RSI works best combined with structure (support/resistance, trend direction) from earlier lessons — it's a confirmation tool, not a standalone system.
- Every platform calculates RSI slightly differently at the edges depending on smoothing method, so compare the same setting across MetaTrader and IG's own platform rather than assuming identical readings.
- No indicator, including RSI, removes trading risk — always size positions properly and check real trading costs with PipTax's tools before committing to a strategy.
Frequently asked questions
- What is a good RSI setting for forex trading?
- The default 14-period setting is a sensible starting point on most timeframes and is what the vast majority of traders and educational material reference, which matters for shared context when discussing charts. Shorter periods (e.g. 7-9) make RSI more sensitive and generate more signals, including more false ones. Longer periods (e.g. 21-25) smooth it out but react slower. Test any change to the default on a demo account across several months of data before relying on it.
- Is RSI above 70 always a sell signal?
- No. Above 70 means recent gains have been large relative to recent losses — it's a sign of strong momentum, not automatically a reversal. In a strong uptrend, RSI can sit above 70 for extended periods while price keeps climbing. Treat it as one input alongside trend direction and price structure, not a trigger on its own.
- What's the difference between RSI and MACD?
- RSI is bounded between 0 and 100 and focuses on the ratio of recent gains to losses, making it useful for spotting overbought/oversold conditions and divergence. MACD is unbounded and focuses on the relationship between two moving averages, making it more suited to identifying trend changes and momentum crossovers. Many traders use both, but they're built differently and answer slightly different questions.
- Does RSI work the same on every broker's platform?
- The core formula is standard, but small differences in smoothing (Wilder's original method versus a simple or exponential moving average variant) mean readings can differ slightly at the margins between platforms, for example between MetaTrader on a Pepperstone server and IG's own charting package. The overall shape and signals are usually consistent; don't expect the exact numeric value to match to the decimal point across platforms.
- Can RSI be used on its own as a full trading strategy?
- It's possible but not advisable at intermediate level. RSI is a momentum indicator that reads price action already on the chart — it doesn't know about news events, spreads, or market structure. Most experienced traders combine it with support/resistance, trend context, and proper risk management rather than trading RSI signals in isolation.