Home › FX Trading School › Pro
Portfolio Heat & Correlated Risk: A Pro Trader's Guide
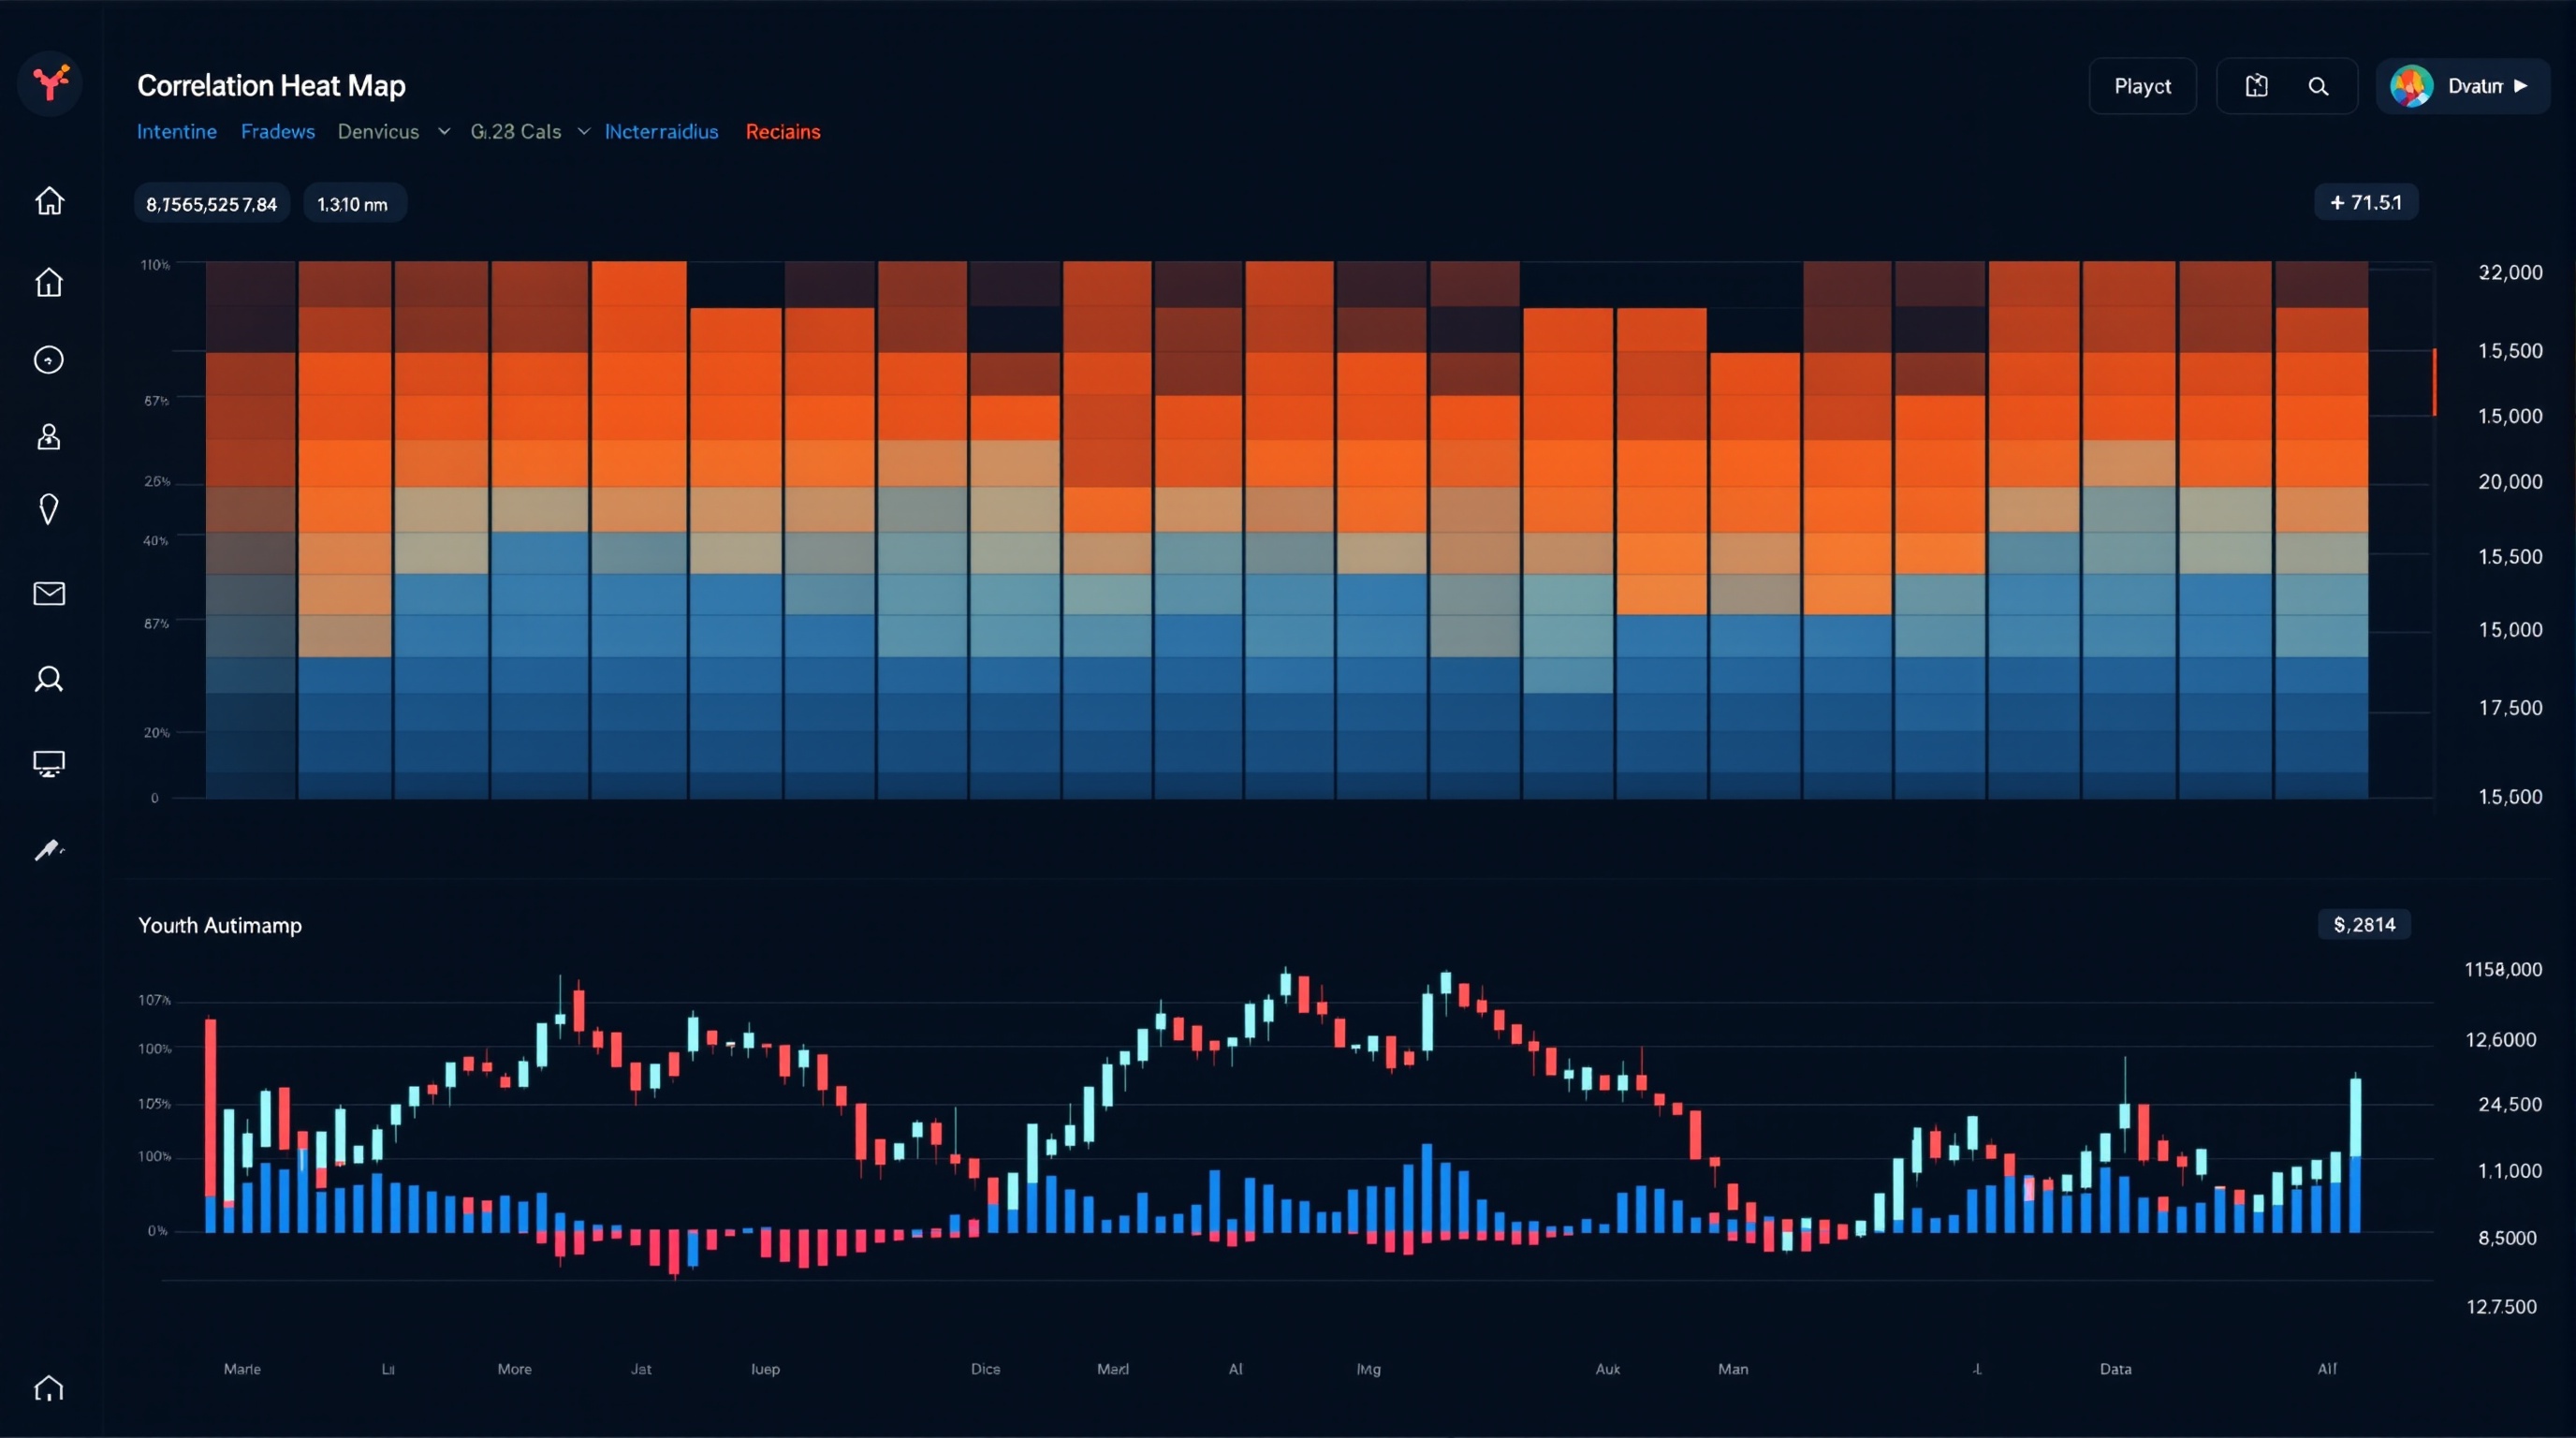
Portfolio heat is the total amount of capital you have genuinely at risk across every open position at once — and for most retail traders, it's badly underestimated because they only ever look at risk one trade at a time. This lesson builds directly on the position-sizing and per-trade risk rules covered earlier in the course, and extends them to the whole portfolio, where correlated pairs can quietly stack risk you never intended to take.
What Portfolio Heat Actually Measures
Per-trade risk answers "how much do I lose if this one stop is hit?" Portfolio heat answers a bigger question: "how much do I lose if several of my open trades go wrong together?" That second question matters because currency pairs rarely move in isolation.
To calculate portfolio heat properly you need:
- Every open position's risk in account currency (distance to stop × position size)
- The correlation between each pair of open positions
- A combined "effective risk" figure, not just a simple sum
If you have three uncorrelated 1% trades, your heat is roughly 3%. If you have three trades on pairs that move together, your effective heat could behave more like a single 3% (or larger) trade — because one market event can hit all three stops at once.
This is the core professional skill this module teaches: separating nominal risk (what your position sizing calculator says) from effective risk (what actually happens to your equity when markets move).
Why Correlated Pairs Multiply Risk
EUR/USD, GBP/USD, and AUD/USD all tend to move against the US dollar to varying degrees. A trader who opens long positions in all three, each sized at 1% risk, might believe they're running 3% total risk. In practice, if the move is driven by broad USD strength or weakness, all three trades win or lose together — meaning the real risk exposure to "USD direction" is closer to 3% concentrated in one bet, not three diversified ones.
Common correlated clusters worth knowing:
- USD majors: EUR/USD, GBP/USD, AUD/USD, NZD/USD often move together against USD strength/weakness
- JPY crosses: USD/JPY, EUR/JPY, GBP/JPY often share yen-driven risk sentiment moves
- Commodity-linked: AUD, NZD, CAD often correlate with commodity prices and risk appetite
- Gold and USD: XAU/USD frequently moves inversely to broad dollar strength
None of these correlations are fixed. They shift with central bank policy divergence, risk-on/risk-off cycles, and unexpected news — which is exactly why heat needs checking regularly, not set once and forgotten.
Building a Simple Correlation Matrix
You don't need institutional software for this. A basic correlation matrix is enough to catch the majority of dangerous overlaps.
Steps:
1. Pull daily closing prices for the pairs you commonly trade (30-60 days is a reasonable window) 2. Calculate the Pearson correlation coefficient between each pair (a simple spreadsheet formula) 3. Build a grid: anything above +0.7 or below -0.7 is a strong correlation worth respecting 4. Re-run this check weekly, and immediately after major central bank events
Reading the matrix:
| Correlation range | What it means | |---|---| | +0.7 to +1.0 | Pairs move together — treat combined positions as one large bet | | -0.7 to -1.0 | Pairs move opposite — a long/long or short/short combo can offset naturally | | -0.3 to +0.3 | Broadly independent — genuine diversification |
This matrix becomes a permanent part of your pre-trade checklist, sitting alongside your position sizing rules.
Setting a Portfolio Heat Ceiling
Once you can see correlated clusters, set two limits rather than one:
- Per-trade risk cap — commonly 0.5-2% of equity, as covered in earlier position-sizing lessons
- Total portfolio heat cap — commonly 5-8% of equity across all open positions, adjusted down further for correlated clusters
A practical rule many professional desks use: if two or more open positions have a correlation above 0.7, treat their combined risk as a single position for the purposes of your heat ceiling — not the sum of two separate allowances.
Worked example:
- Trade A: EUR/USD long, 1% risk
- Trade B: GBP/USD long, 1% risk
- Correlation between the two: 0.82
Effective heat from this cluster ≈ 1.5-2% (not 2%, but not 1% either — somewhere in between depending on how tightly they move together), so you'd have less room left for a third uncorrelated trade before hitting your 5-8% ceiling.
Adjusting Position Size for Correlation
Once you've identified a correlated cluster, you have three practical levers:
- Reduce size on the second and third correlated trade — if you're already long EUR/USD, size a new GBP/USD long smaller than you would if it were your only position
- Skip the trade entirely if your heat ceiling is already close to being hit
- Diversify into a genuinely uncorrelated instrument instead, if the setup quality is similar
This is also where broker mechanics matter. Margin requirements, swap rates, and even execution differences between a MetaTrader environment — such as Pepperstone's MT4/MT5 servers — and a proprietary platform like IG's own dealing platform can affect how "expensive" it is to hold multiple correlated positions overnight. Swap costs on three correlated pairs held long-term can add up differently depending on the broker, so it's worth checking real numbers on the cost tool at /audit.html and comparing broker-specific conditions on /brokers/index.html before assuming position sizing is your only cost consideration.
Common Mistakes That Inflate Portfolio Heat
Watch for these recurring errors:
- Treating "different pair" as "different risk" — GBP/JPY and EUR/JPY can share more risk than the ticker symbols suggest
- Ignoring correlation shifts — a pair correlated at 0.3 last month can jump to 0.8 after a policy surprise
- Forgetting non-FX instruments — gold, indices, and even crypto CFDs can correlate with your FX book
- Only checking heat at trade entry — heat changes as trades move into profit or loss and as new positions open
- Confusing hedging with heat reduction — opposite positions in correlated pairs cut directional risk but add spread and swap cost on both legs, which is rarely efficient for retail-sized accounts
Building a habit of checking your correlation matrix and recalculating total heat before every new trade is the single biggest upgrade a discretionary trader can make at this stage of the course.
Conclusion: Make Portfolio Heat Part of Every Trade Decision
Portfolio heat is what separates traders who think they're diversified from those who actually are. Checking correlation before adding a new position, capping total heat rather than just per-trade risk, and re-running your matrix regularly won't guarantee profits — nothing does, and most retail accounts still lose money even with good risk controls. But it will stop a single market driver from doing far more damage to your account than your position sizing rules ever intended. Pair this discipline with real cost data from /audit.html and broker comparisons at /brokers/index.html, and revisit /school/index.html for the earlier modules this lesson builds on.
Key takeaways
- Portfolio heat is the total capital-at-risk across all open positions, not just the risk on a single trade
- Correlated pairs (e.g. EUR/USD and GBP/USD) can silently multiply your real exposure to a single market driver
- A simple correlation matrix, updated weekly, is enough to catch most dangerous overlaps
- Cap total portfolio heat (commonly 5-8% of equity) as well as per-trade risk (commonly 0.5-2%)
- Correlation is not stable — it shifts with news cycles and central bank divergence, so re-check it regularly
- Use the PipTax cost tool and broker pages to factor in swap and margin differences when sizing correlated positions
Frequently asked questions
- What is a safe level of portfolio heat?
- There's no universal number, but many professional risk frameworks cap total open risk at 5-8% of account equity at any one time, with no single trade risking more than 0.5-2%. The right figure depends on your strategy's win rate, average reward-to-risk, and how much drawdown you can psychologically and financially tolerate. The point of Module 14 is building the workflow to calculate your own ceiling, not copying someone else's number.
- How do I check currency pair correlation without paid software?
- Most charting platforms, including MetaTrader (used by brokers such as Pepperstone) and proprietary platforms like IG's, let you overlay price charts or export historical closes to calculate a Pearson correlation coefficient in a spreadsheet. Free correlation matrix tools are also widely available online. Update your check weekly, since correlation is not fixed.
- Does correlation apply to non-FX instruments like gold or indices?
- Yes. Gold often correlates with USD pairs, and equity indices can correlate with risk-sensitive currencies like AUD or JPY crosses. If you trade a mixed portfolio of FX, metals, and indices, include them all in your correlation check rather than treating FX as an isolated silo.
- Is hedging correlated pairs a good way to reduce heat?
- Opening opposite positions in correlated pairs can offset directional risk, but it also doubles your spread and swap costs and ties up margin on both sides. It's rarely a clean solution for retail accounts. Reducing position size or closing overlapping trades is usually more efficient — check real costs on the cost tool before assuming a hedge is cheap.
- How often should I recalculate portfolio heat during a trading session?
- Recalculate every time you open, close, or adjust a position, and again whenever a major news event shifts correlations (e.g. a surprise central bank decision). A quick mental or spreadsheet check before adding a new trade is the minimum professional standard.