Home › FX Trading School › Intermediate
Multi-Timeframe Analysis Explained: A Practical Guide
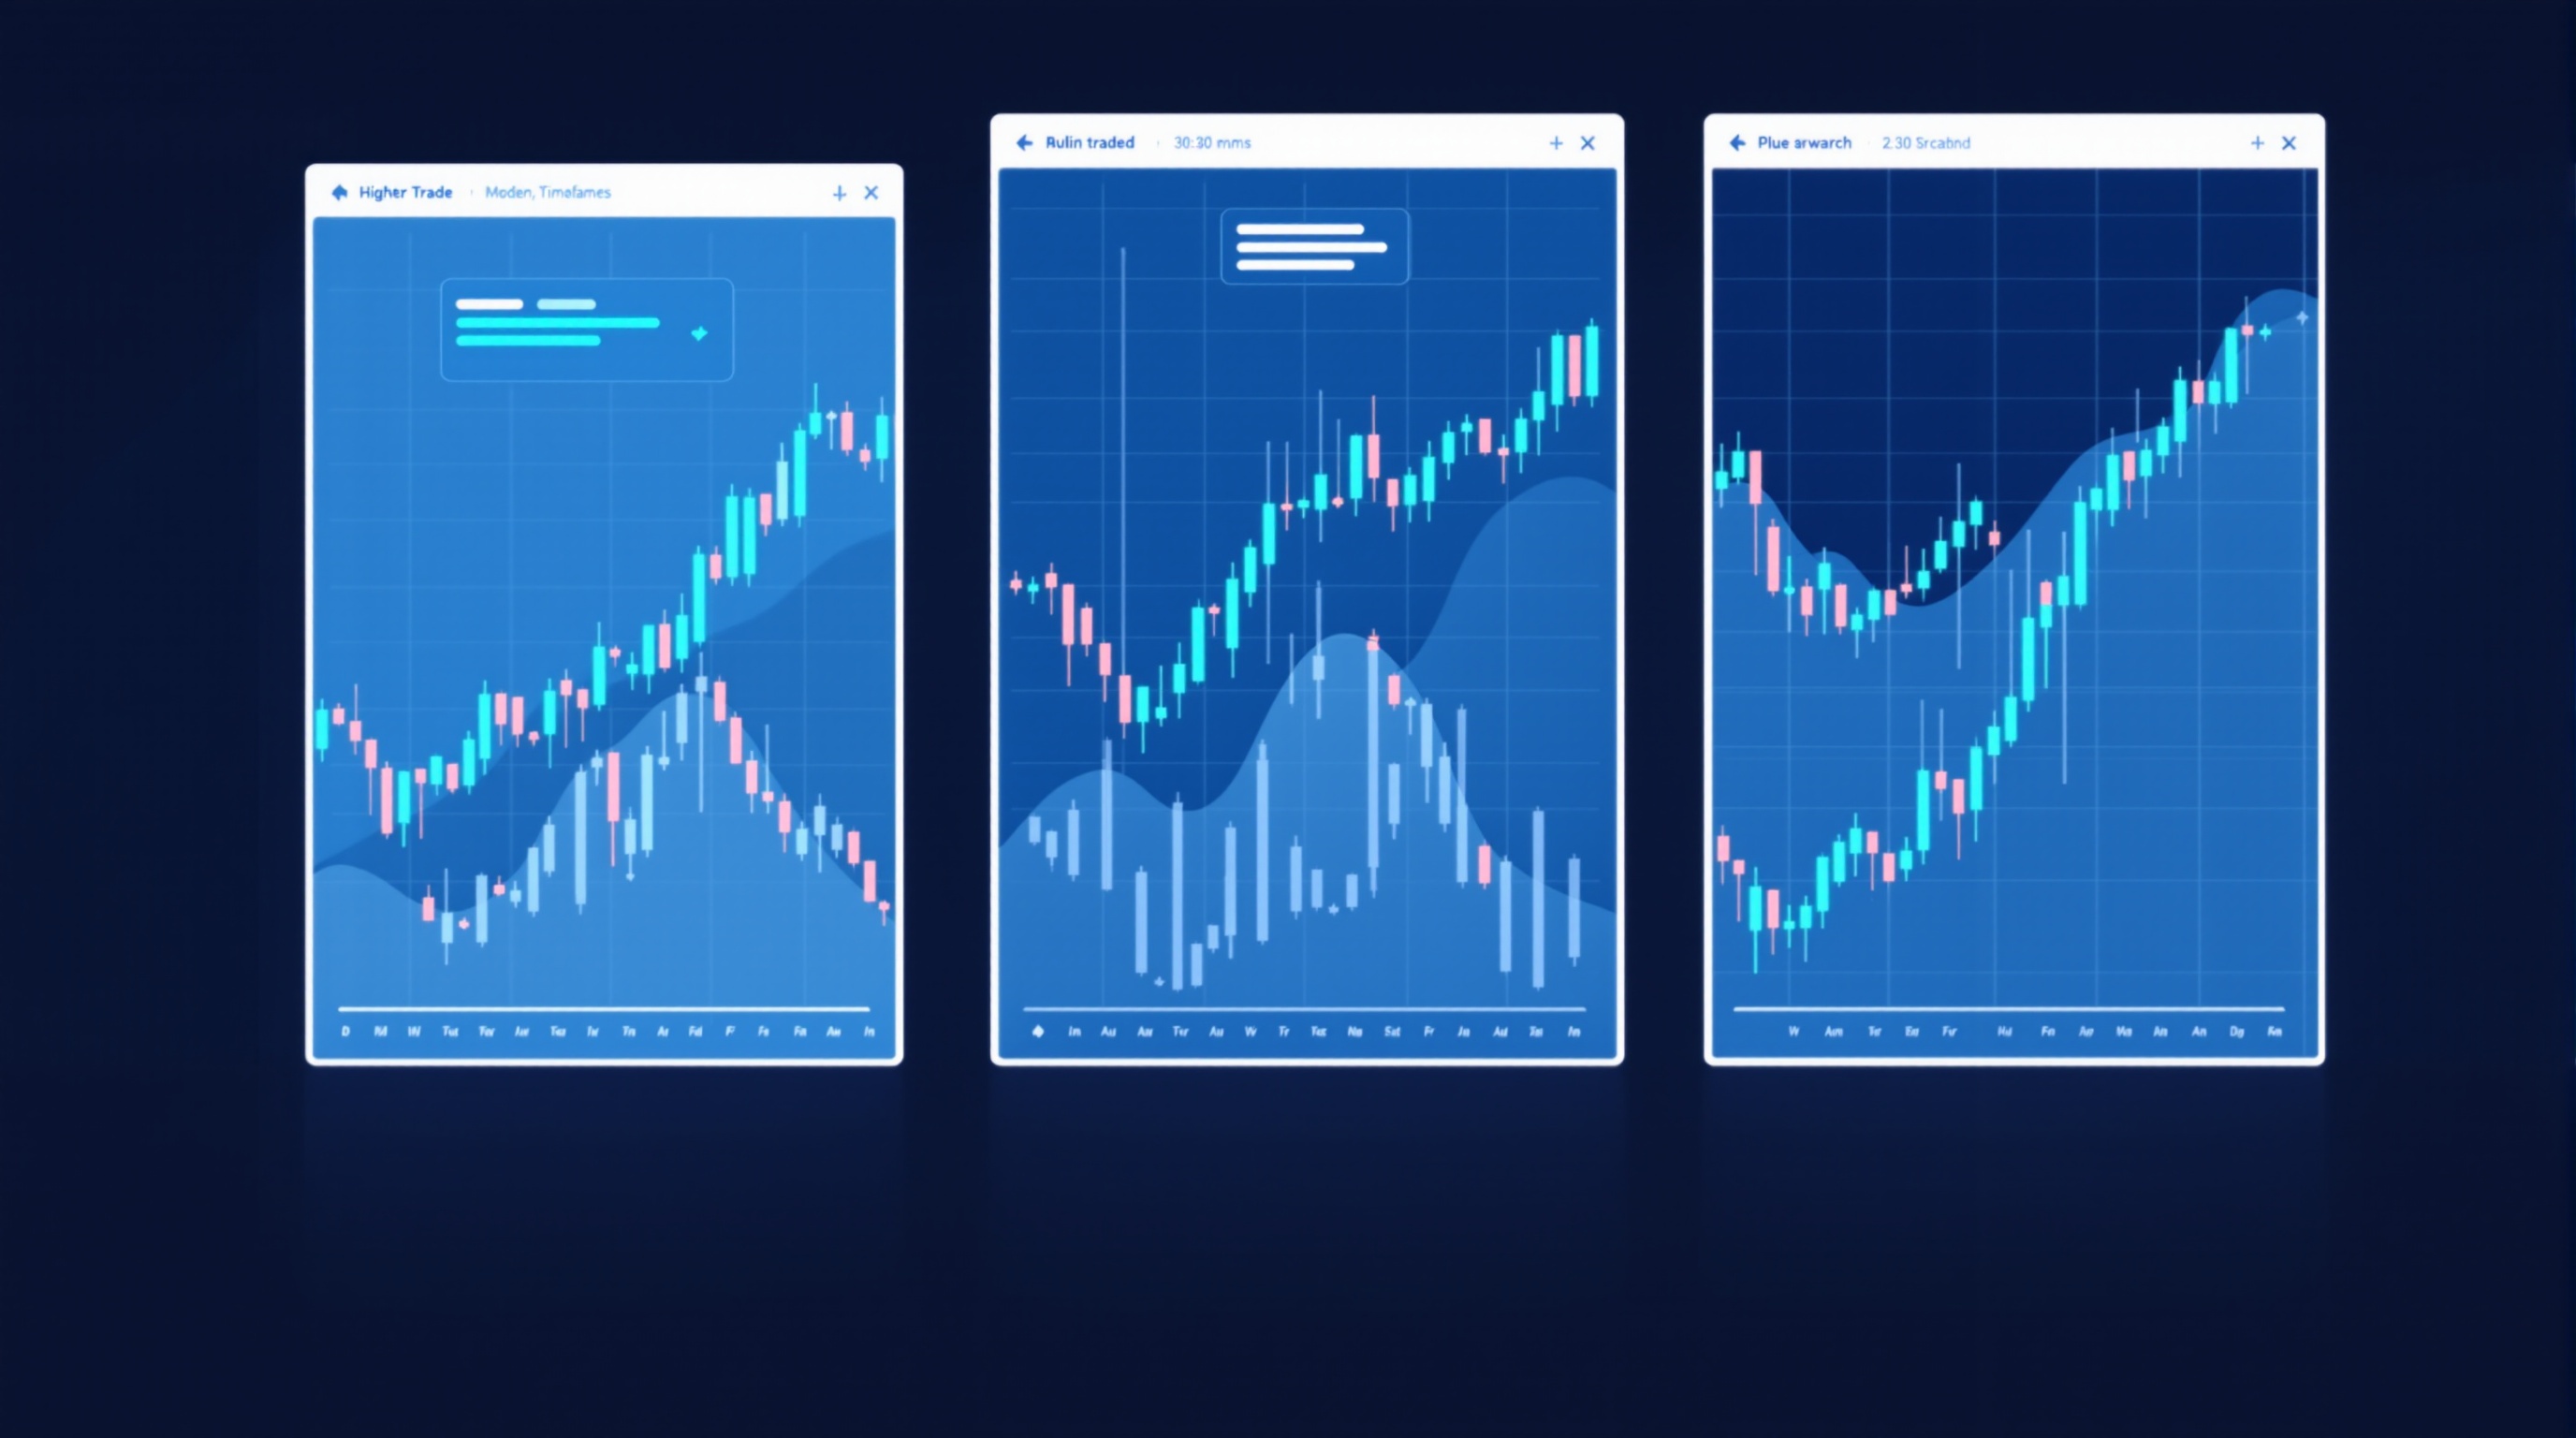
Multi-timeframe analysis is the practice of checking the same currency pair on more than one chart timeframe before you trade it, so you don't mistake a short-term wiggle for the real trend or miss the bigger picture entirely. It's one of the most useful habits an intermediate trader can build, and it costs nothing but a bit of screen time.
If you've worked through the earlier lessons in this module on trend identification and support and resistance, this lesson ties them together. Multi-timeframe analysis is really just applying those two skills at more than one zoom level, then using the results together instead of in isolation.
Why One Chart Isn't Enough
A single timeframe only tells you part of the story. A 5-minute chart might show a clean uptrend, but zoom out to the daily chart and that "uptrend" could just be a small bounce inside a much larger downtrend. Trade the 5-minute signal alone and you're buying into a falling market — a classic beginner mistake.
The core problem is that price structure is fractal: trends, ranges, and reversals appear at every timeframe, but they don't always agree with each other. What looks decisive on one chart can look like noise on another. Multi-timeframe analysis exists to resolve that conflict before you risk money on it, not after.
Practical reasons to check more than one timeframe:
- Context — is this move part of a bigger trend, or a countertrend pullback?
- Better entries — a higher timeframe tells you *what* to trade; a lower one tells you *when*.
- Fewer false signals — a pattern that appears on multiple timeframes carries more weight than one on a single chart.
- Risk placement — structure on a higher timeframe often gives you a more sensible stop-loss level than the lower timeframe alone.
None of this removes risk. Trading remains risky on every timeframe, and most retail accounts lose money — multi-timeframe analysis simply gives you better information to work with.
The Three-Timeframe Framework
Most traders settle on three timeframes, each with a specific job. Trying to track five or six charts at once usually just adds confusion.
| Timeframe | Role | Question it answers | |---|---|---| | Higher | Bias / trend | Which direction should I be favouring? | | Middle | Structure | Where are the key zones (support, resistance, ranges)? | | Lower | Entry | Where exactly do I get in, and where's my stop? |
A common day-trading setup is 4-hour → 15-minute → 5-minute. A common swing-trading setup is daily → 4-hour → 1-hour. The exact numbers matter less than the ratio: each step down should be roughly 4–6 times more granular than the one above it, so each chart genuinely adds new information rather than repeating the same picture.
Pick your three timeframes based on how long you intend to hold a trade, not the other way round — decide your holding period first, then choose charts that suit it.
Step-by-Step: Doing a Top-Down Analysis
Work from the highest timeframe down. This "top-down" order matters — starting on the lowest timeframe and working up tends to bias you toward whatever the small chart is showing.
1. Open the higher timeframe first. Identify the trend using the same tools from the trend-identification lesson — higher highs/higher lows for an uptrend, or the reverse for a downtrend. Note obvious support and resistance levels. 2. Move to the middle timeframe. Mark where price sits relative to those higher-timeframe levels. Is it approaching a zone, mid-range, or breaking out? 3. Drop to the lower timeframe. Look for an entry trigger — a candlestick pattern, a break of a minor structure, a pullback into a zone — that aligns with the bias set on the higher timeframe. 4. Set your stop using structure, not an arbitrary pip count, ideally referencing the middle timeframe. 5. Re-check the higher timeframe periodically while the trade is open, since a shift there outranks anything happening lower down.
This whole process might take five minutes once it's a habit. It's worth doing before every trade, not just the ones that feel uncertain.
When Timeframes Disagree
They will disagree regularly — that's normal, not a flaw in the method. The standard rule: the higher timeframe outranks the lower one.
- Daily uptrend + 15-minute pullback → treat the pullback as a potential buying opportunity, not a reversal.
- Daily downtrend + 1-hour rally → treat the rally as a likely retracement to fade, not a new trend to chase.
- Two timeframes both aligned in the same direction → higher-confidence setup, though never a certainty.
Trading against the higher timeframe trend is a legitimate but distinctly different, lower-probability, counter-trend approach. If you choose to do it, it demands tighter stops, smaller position sizes, and honest acceptance that you're going against the dominant flow.
Setting This Up on Your Platform
Both MetaTrader (as offered on Pepperstone's servers) and IG's own platform let you open the same pair on multiple chart windows and switch timeframes in a couple of clicks. Some practical setup tips:
- Use consistent chart templates across timeframes so trend lines and levels carry over clearly in your head.
- Label your zones on the higher timeframe chart so you don't have to re-find them every session.
- Don't over-refresh the lowest timeframe — checking a 1-minute chart every few seconds invites overtrading and second-guessing.
- Keep your three timeframes on separate windows or tabs rather than constantly switching one chart back and forth.
Whichever platform you use, remember that every additional trade you take — especially on faster lower-timeframe entries — carries spread and possibly commission or swap costs. Multi-timeframe analysis doesn't change the mechanics of pricing, but it can change how often you trade, which affects what you pay over time. Compare live costs across venues on the [cost tool](/audit.html) and check broker specifics on the [brokers page](/brokers/index.html) before settling into a routine.
Common Mistakes to Avoid
- Cherry-picking the timeframe that agrees with you. If you want a trade to work, it's tempting to ignore the higher timeframe that contradicts it. Don't.
- Using too many timeframes. Three is usually plenty; more often just delays decisions.
- Ignoring the middle timeframe. It's easy to focus on trend (high) and entry (low) and skip the structure layer that actually places your stop sensibly.
- Forgetting to re-check the higher timeframe once a trade is running — trends do shift.
- Treating alignment as a guarantee. Even a perfectly aligned setup across three timeframes can lose. It's a probability tool, not a certainty machine.
Conclusion
Multi-timeframe analysis won't make trading easy, but it does stop you trading half the picture. By setting a bias on a higher chart, confirming structure on a middle chart, and timing entries on a lower chart, you bring more context to every decision — and that context, applied consistently, is what separates a plan from a guess. Practise the three-step framework on demo charts using Pepperstone or IG's platforms before committing real risk, and always check your actual trading costs on the [cost tool](/audit.html) so your strategy and your spending line up. For the next lesson in this module, head back to the [FX Trading School index](/school/index.html).
Key takeaways
- Multi-timeframe analysis means checking at least three timeframes so higher ones set the bias and lower ones time the entry.
- A common structure is a higher timeframe for trend, a middle timeframe for structure/zones, and a lower timeframe for entry triggers.
- Trading against the higher timeframe trend is possible but is a lower-probability, counter-trend approach that needs stricter risk control.
- Conflicting signals across timeframes are normal — the rule is the higher timeframe always outranks the lower one when they disagree.
- This builds directly on trend identification and support/resistance from earlier price action lessons in Module 7.
- Spreads and swaps still apply on every timeframe you trade, so check live costs via the cost tool before choosing a strategy.
Frequently asked questions
- How many timeframes should I use in multi-timeframe analysis?
- Three is the practical standard: one higher timeframe for overall trend and bias, one middle timeframe for structure and key zones, and one lower timeframe for precise entry timing. Using more than three often adds noise rather than clarity, especially at the intermediate stage.
- What if the trend disagrees between timeframes?
- This happens often and isn't a fault in the method — it's information. The general rule is the higher timeframe wins: if the daily is bullish but the 15-minute is dipping, that dip is more likely a pullback to buy than the start of a new bearish trend. Trading against the higher timeframe is possible but is a distinctly lower-probability, counter-trend style that needs tighter risk control.
- Which timeframes work best for day trading versus swing trading?
- Day traders commonly use a 4-hour or 1-hour chart for bias, a 15-minute chart for structure, and a 1-minute or 5-minute chart for entries. Swing traders typically shift everything up a level: weekly or daily for bias, 4-hour for structure, and 1-hour for entries. The ratio between timeframes matters more than the exact numbers.
- Does multi-timeframe analysis change my trading costs?
- Not directly, but it does change how often you trade and on what chart, which affects how much spread and any commission or swap you pay. Shorter-timeframe entries mean more frequent trades and more spread paid over time, so it's worth checking live costs on the cost tool before settling on a style.
- Can I do multi-timeframe analysis on any broker platform?
- Yes. Both MetaTrader (used by brokers such as Pepperstone) and IG's own platform let you switch timeframes on the same chart in a couple of clicks, and most traders keep two or three chart windows open side by side for the different timeframes.