Home › FX Trading School › Intermediate
Moving Averages: How to Use Them in Your Trading
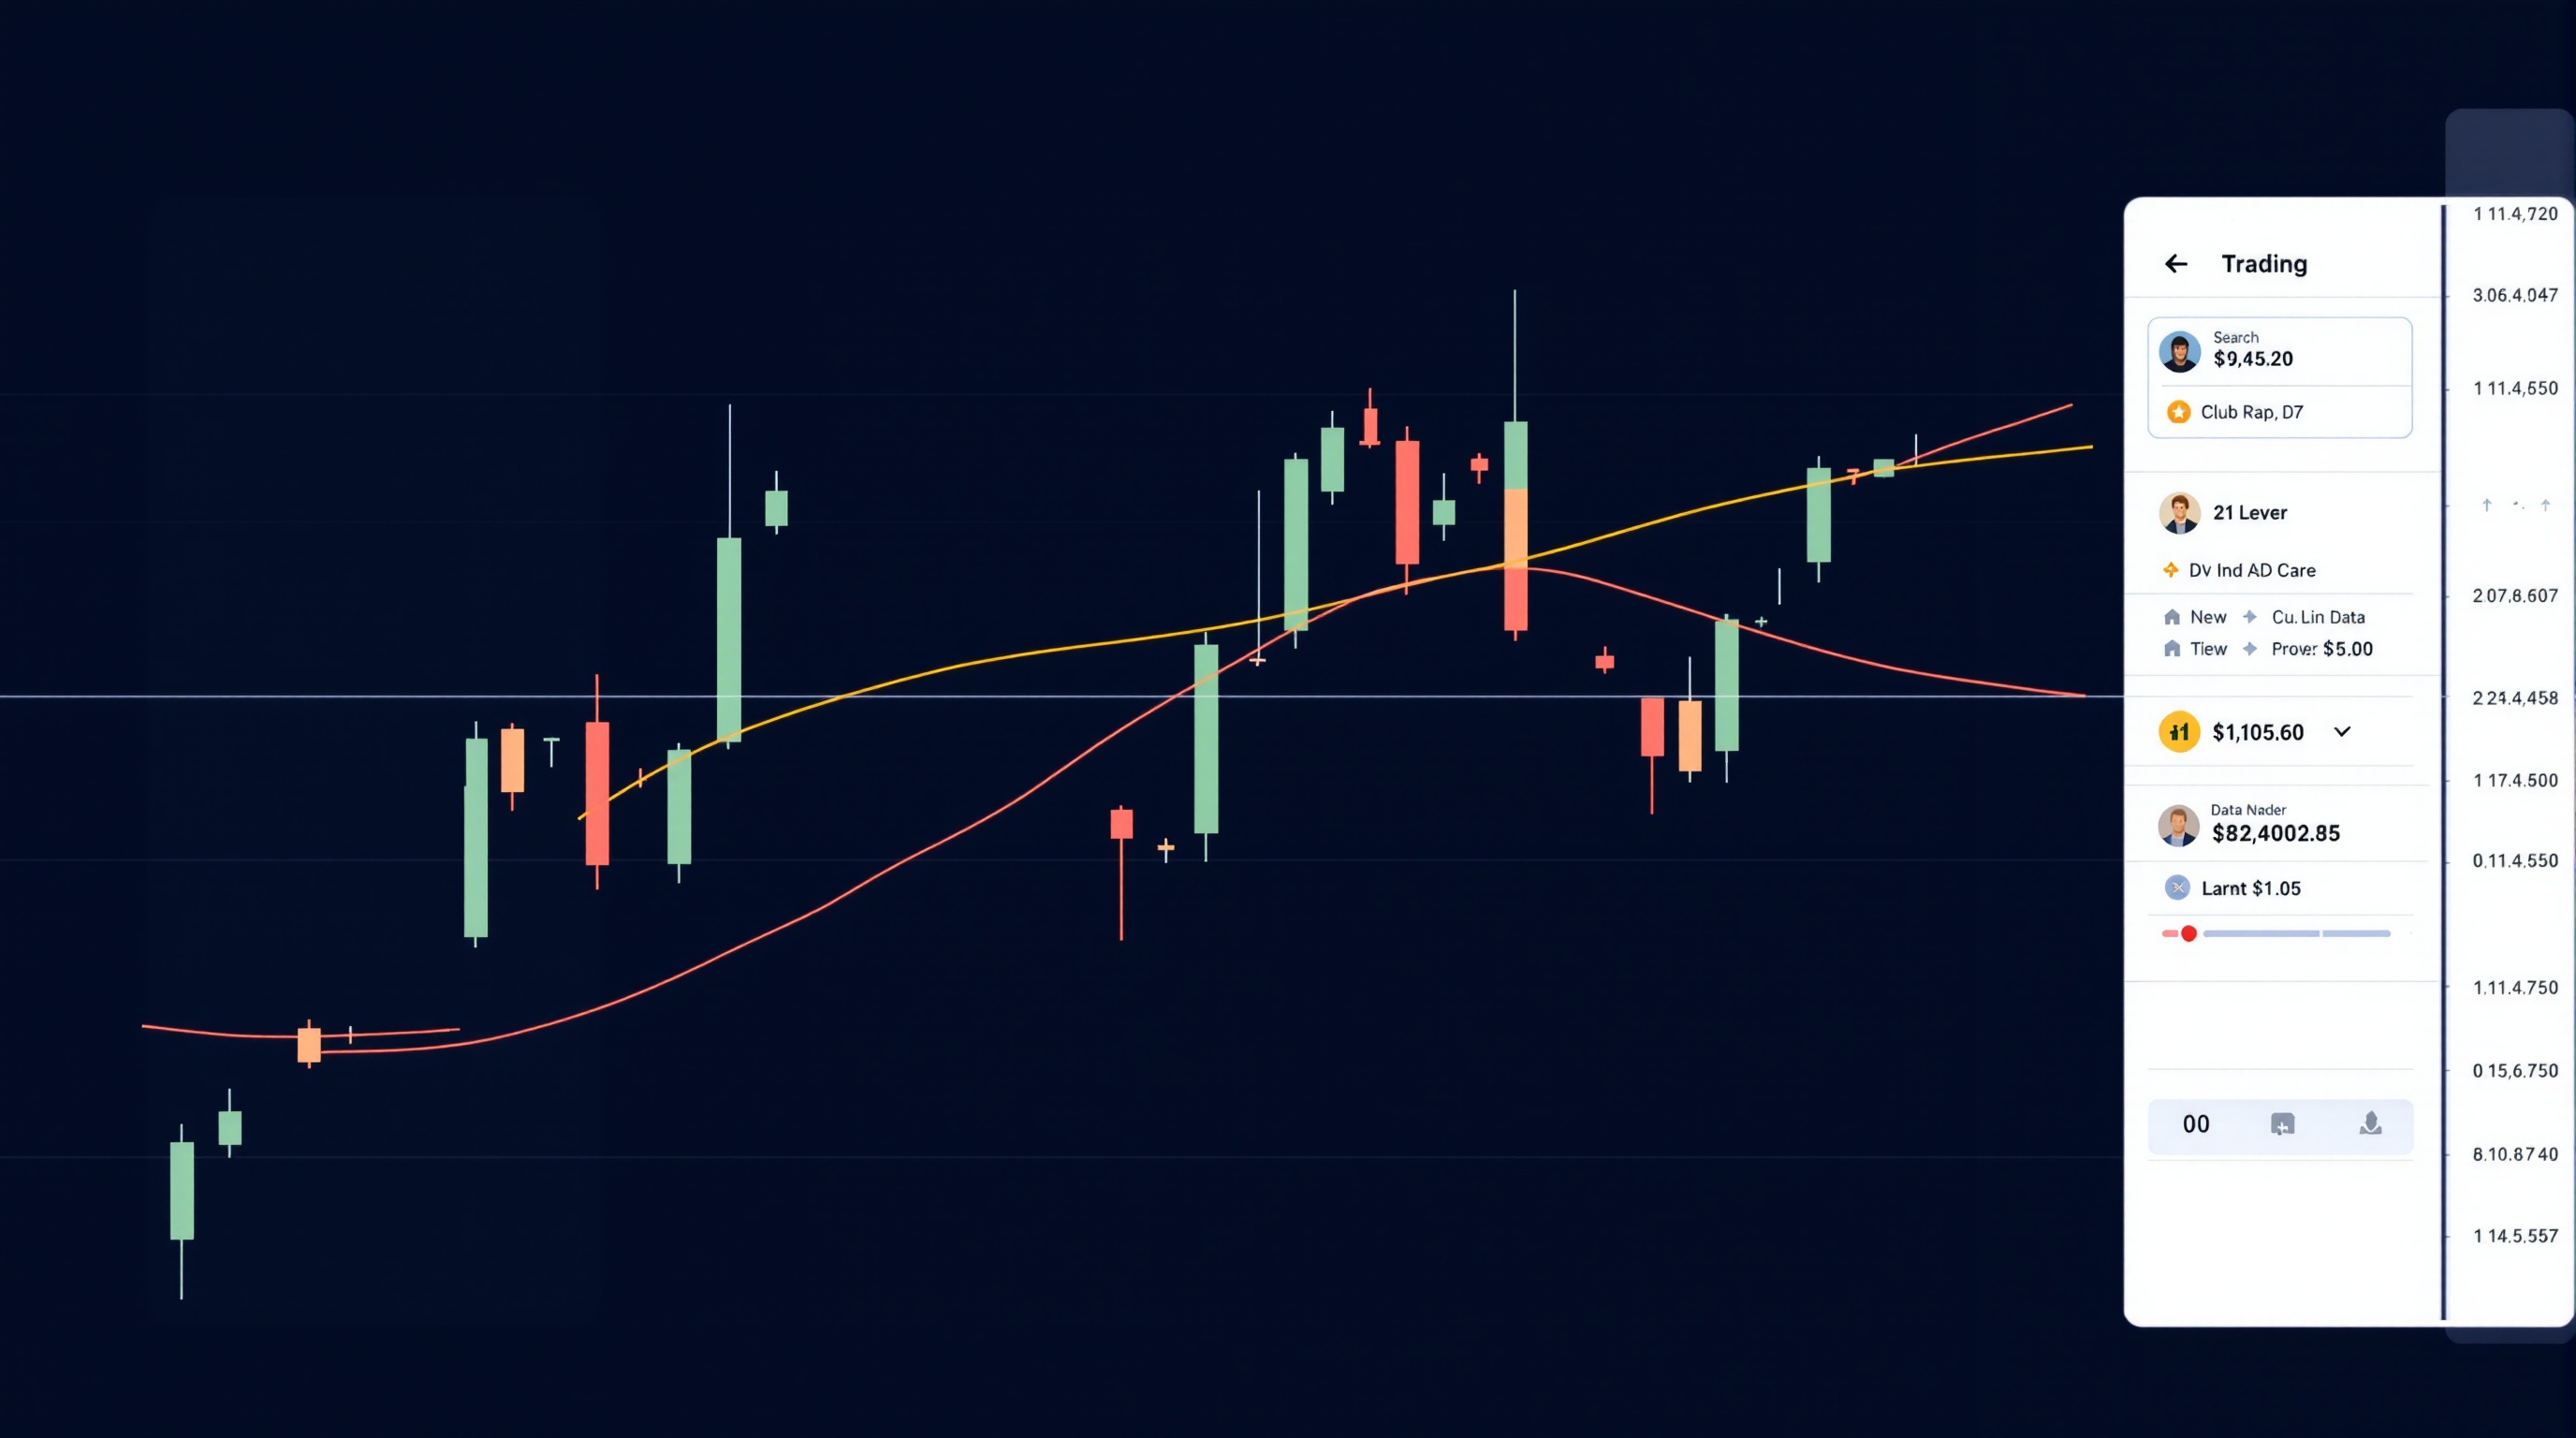
Moving averages are one of the first tools most traders meet, and they stay useful long after you've moved on to more complex analysis. This lesson builds on Module 5's introduction to trend and price structure and shows you how to use moving averages properly — not as a magic signal, but as a way to see the market more clearly.
What a moving average actually shows you
A moving average smooths out price by plotting the average price over a set number of periods, updated as each new candle closes. That's it — there's no prediction involved, only a clearer view of where price has been.
The two versions you'll meet constantly:
- Simple Moving Average (SMA) — adds up the closing prices for the last *N* periods and divides by *N*. Every period counts equally.
- Exponential Moving Average (EMA) — weights recent prices more heavily, so it reacts faster to new moves.
Common settings you'll see on almost every platform, including IG's own charting and MetaTrader on Pepperstone's servers, are 20, 50, 100 and 200 periods. Shorter periods (like 20) hug price closely and react fast but whipsaw more in choppy conditions. Longer periods (like 200) are smoother and slower, used more for gauging the broader trend than for timing entries.
Neither SMA nor EMA is "correct" — they answer slightly different questions. SMA gives you a steadier read of the average; EMA gives you an earlier warning that momentum is shifting. Many traders use both together rather than picking a side.
Reading trend direction with a single moving average
The simplest use of moving averages is as a trend filter. Plot one — say a 50-period EMA — on your chart and ask two questions:
1. Is price above or below the line? Above generally suggests an uptrend bias; below suggests a downtrend bias. 2. Which way is the line itself sloping? A flat or choppy average usually means there's no clean trend to trade — this matters as much as price's position relative to it.
This is where moving averages earn their keep for intermediate traders: not as an entry trigger, but as a filter that stops you fighting the dominant trend. If price is consistently below a rising 200-period average, treat rallies as potential shorting opportunities rather than reasons to buy — and vice versa.
A word of caution: in a genuinely range-bound market, price will cross a single moving average repeatedly, generating false signals in both directions. Combine this read with the support and resistance concepts from Module 4 before acting on it alone.
Moving average crossovers
A moving average crossover uses two averages of different lengths — for example a 20-period and a 50-period — plotted together:
- Golden cross — the shorter average crosses above the longer one, often read as a bullish shift.
- Death cross — the shorter average crosses below the longer one, often read as a bearish shift.
Crossovers are popular because they're simple and visual, but they lag by nature — by the time the cross happens, a meaningful chunk of the move has usually already occurred. That's the trade-off with any moving average: smoothing removes noise, but it also removes speed.
Some traders use crossovers as a standalone signal; more experienced ones use them as confirmation alongside other tools — price action at a key level, momentum readings, or the higher-timeframe trend. Treat a crossover as one vote, not a verdict.
Using moving averages as dynamic support and resistance
In a trending market, price often pulls back to a moving average and bounces, effectively treating it as dynamic support (in an uptrend) or resistance (in a downtrend). This is one of the more reliable practical uses of moving averages at an intermediate level:
- Identify a clear trend using a longer average (e.g. 100 or 200 period).
- Wait for a pullback toward a shorter average (e.g. 20 or 50 period).
- Look for a reaction — a rejection wick, a slowing of momentum — before considering an entry in the trend's direction.
This is not guaranteed to work every time; price frequently slices straight through a moving average, especially around news events or low-liquidity sessions. Always define your invalidation point (a stop) before entering, regardless of how clean the setup looks.
Building a simple, honest MA-based workflow
Here's a practical structure an intermediate trader can actually use, rather than just theory:
| Step | Tool | Purpose | |---|---|---| | 1 | 200-period MA on higher timeframe | Establish broad trend bias | | 2 | 50-period MA on trading timeframe | Confirm intermediate trend direction | | 3 | 20-period MA | Spot pullback entries and short-term momentum | | 4 | Price action at the 20/50 MA | Time the actual entry and stop placement |
Test this on a demo account first. Moving average settings that "work" in hindsight on one pair or timeframe won't automatically transfer to another — always validate the logic yourself rather than copying a number you saw online.
Costs still matter more than the indicator
No moving average setup, however well-tuned, overrides the basic maths of trading costs. If you're using MA crossovers on shorter timeframes with more frequent entries, spread and commission eat into results faster than on a swing-trading approach. Before committing to any MA-based strategy:
- Run your instrument and expected trade frequency through PipTax's [cost impact tool](/cost-impact.html) to see how spread and commission scale with your style.
- Compare live spread and commission data across brokers on the [brokers page](/brokers/index.html) — don't assume; check.
- Use the [audit tool](/audit.html) to see how your actual account costs stack up against what you'd planned for.
A profitable-looking MA strategy on paper can be marginal once realistic costs are applied — this is precisely why PipTax treats cost analysis as inseparable from strategy design.
Conclusion: moving averages as a tool, not a shortcut
Moving averages won't predict the market, and no crossover or bounce setup removes the risk that trading carries — most retail accounts lose money, and this lesson doesn't change that. What moving averages *do* give you is a consistent, repeatable way to read trend, filter trades, and time entries with a bit more discipline than eyeballing candles alone. Use them alongside support/resistance, price action, and a clear-eyed view of your trading costs, and they earn their place on your chart.
Continue to the next lesson in the [FX Trading School](/school/index.html) to build on this with momentum indicators.
Key takeaways
- A moving average smooths price over a set number of periods — SMA weights all periods equally, EMA reacts faster to recent price
- Use a single moving average as a trend filter: price and slope relative to the line, not as a standalone entry trigger
- Crossovers (golden cross/death cross) lag the market by nature and work best as confirmation, not a sole signal
- Pullbacks to a rising or falling moving average can offer trend-following entries, but always define a stop first
- MA settings that look good in hindsight need forward testing on demo before real use
- Higher trade frequency from MA-based strategies increases the impact of spread and commission — check this with PipTax's cost tools before committing
Frequently asked questions
- What's the best moving average setting to use?
- There's no universal best setting — 20, 50, 100 and 200 periods are common starting points, but the right choice depends on your timeframe, pair, and strategy. Test settings on a demo account rather than copying a number from elsewhere.
- Should I use SMA or EMA?
- Neither is objectively better. SMA gives a steadier, slightly delayed read of average price; EMA reacts faster to recent moves but can whipsaw more in choppy conditions. Many traders plot both and compare.
- Do moving average crossovers work as a trading strategy on their own?
- They can generate signals, but because they lag price, standalone crossover systems often enter late. Most intermediate and advanced traders use crossovers as confirmation alongside price action, support/resistance, or momentum tools.
- Why does my moving average strategy look profitable in backtests but not live?
- Backtests often understate real trading costs. Run your strategy's expected trade frequency and instrument through PipTax's cost impact tool to see how spread and commission affect results at your actual trading pace.
- Can I use moving averages on any broker's platform?
- Yes — moving averages are a standard feature on virtually all platforms, including IG's own charting and MetaTrader on Pepperstone's servers. The indicator works the same way regardless of broker; what differs is your execution costs, which you should check on the brokers page.