Home › FX Trading School › Advanced
Building a Realistic Trade-Cost Model (Module 18)
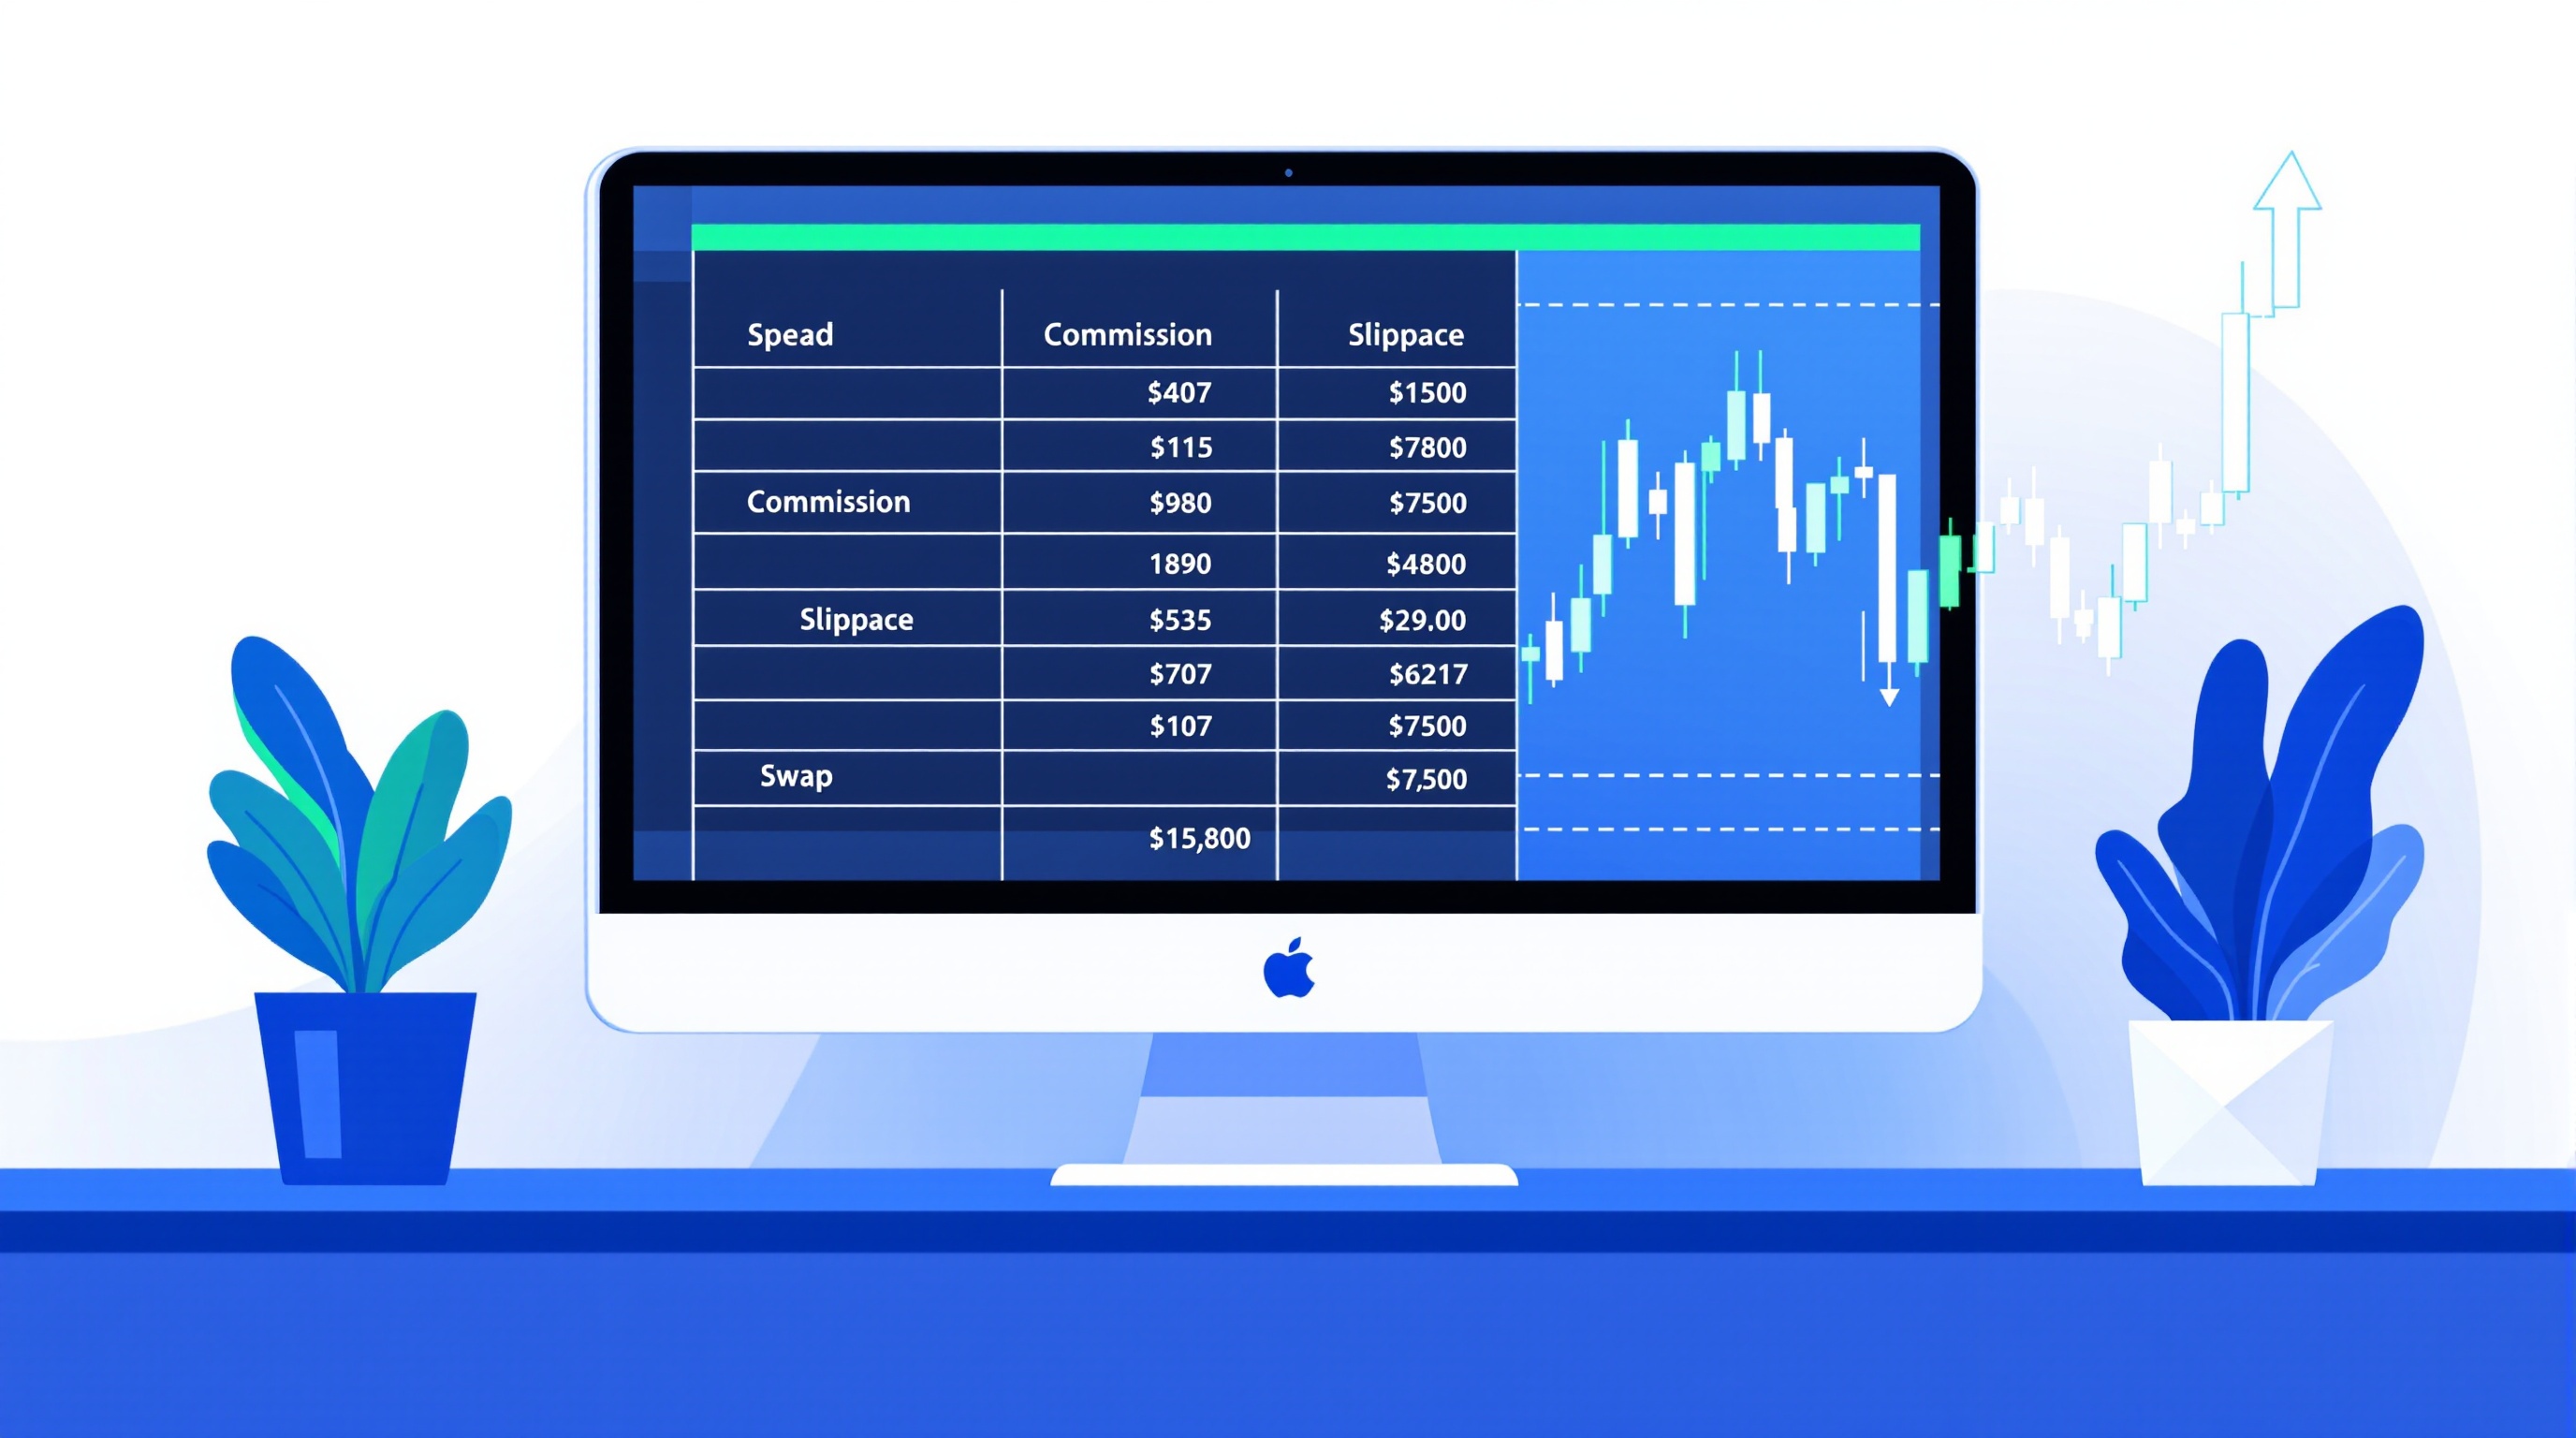
A trade-cost model is the tool that turns vague gut feel about "costs eating my edge" into a number you can actually test against your strategy's expectancy. By Module 18 you should already understand [the anatomy of the spread](/school/index.html), how commission-based accounts differ from all-in spread accounts, and how swap is charged for positions held overnight. This lesson puts those pieces together into a single model you can run before you risk a penny.
Why a single "spread number" isn't enough
Most retail traders price a strategy using one number — the quoted spread at the moment they glance at the platform. That's not what you'll actually pay over hundreds of trades. A proper trade-cost model separates costs into distinct components because each behaves differently:
- Spread — varies by session, pair and volatility; widens sharply around news
- Commission — usually fixed per lot on ECN/raw accounts, so it's predictable
- Swap/rollover — depends on direction, currency pair, and whether it's a triple-swap day
- Slippage — the gap between requested and filled price, worse in fast markets or on stops
- Market impact — relevant mainly at larger size, where your own order moves the price
Treating these as one blended "cost" hides which component is actually hurting you. A scalper bleeding out on spread needs a different fix (session timing, account type) than a swing trader bleeding out on swap (direction bias, holding period). Before you can separate the sources, you need honest inputs — which is why the next section is about live data, not textbook averages.
Step 1: gather real inputs, not guesses
Your model is only as good as its inputs. Don't estimate — pull actual figures:
1. Spread — log the spread at the times you actually trade (e.g. London open, US session), not the headline "from 0.0 pips" marketing figure 2. Commission — check your account type's per-lot commission; this differs meaningfully between, say, a standard account and an ECN/raw account 3. Swap — pull the current long/short swap for your pair; these change and are published by the broker, not fixed forever 4. Slippage — review your own fill reports, or start with a conservative estimate (0.1–0.5 pips on majors in normal conditions, more around news)
Rather than trawling multiple broker platforms manually, PipTax's [cost tool](/audit.html) pulls live spread, commission and swap data so you can build inputs quickly and compare across brokers — for example Pepperstone's Razor account against IG's standard offering — without hunting through PDF fee schedules. Always check the live number for your exact pair and account before finalising the model; costs change, and any number you saw last month may already be stale.
Step 2: build the per-trade cost formula
Once you have real inputs, the core formula is simple:
Total cost per trade = (Spread in pips × pip value) + Commission + (Swap × nights held) + Slippage estimate
A worked example, figures for illustration only — replace with live data from the cost tool:
| Component | Example value | Notes | |---|---|---| | Spread | 0.8 pips | EUR/USD, London session | | Commission | £3.50/lot round turn | ECN-style account | | Swap | –£0.60/night | Short EUR/USD, held 2 nights | | Slippage | 0.2 pips | Conservative, limit entry |
Add these up per lot, per trade, then multiply by your typical trade frequency to get a monthly cost figure. This is where the exercise stops being abstract: a strategy earning 8 pips average per trade with 3 pips of blended cost has a genuinely different risk profile than the same strategy quoted with 0 costs.
Step 3: layer in variable and tail costs
Averages hide the trades that hurt most. Your model needs a variable layer:
- News widening — spreads on majors can multiply several times over during NFP or a surprise rate decision; model a "stress" cost alongside your "normal" cost
- Weekend/holiday swap — most brokers charge triple swap on a specific day to account for weekend settlement; check which day your broker uses
- Broker-specific slippage behaviour — some platforms and servers fill more precisely than others under load; this is worth checking directly via each broker's execution stats or your own trade history on, say, Pepperstone's MetaTrader servers versus IG's own platform
- Requotes and rejections — rare on modern ECN accounts but worth logging if you trade a broker with dealing-desk elements
Build two scenarios in your spreadsheet: "typical session" and "stress event." If your strategy only survives on the typical-session number, you have a fragile edge, not a robust one.
Step 4: connect the model to your strategy's expectancy
A trade-cost model is only useful once it's plugged into your actual expectancy calculation. Take your strategy's average pips gained per winning trade and pips lost per losing trade, then subtract the blended cost per trade from both sides before calculating expectancy. This is the step most traders skip, and it's why backtests that look profitable on paper quietly fail live.
Use [PipTax's cost-impact tool](/cost-impact.html) to see how sensitive your specific strategy is to cost changes — a small rise in average spread or a broker with wider swap can turn a marginal edge negative long before you notice it in your equity curve.
Common mistakes when modelling trade costs
- Using headline "from" spreads instead of the session-specific number you'll actually trade at
- Ignoring swap direction — a strategy that's long-biased on a currency pair with negative long swap quietly erodes returns over time
- Forgetting commission on both legs — some brokers charge round-turn, others charge per side; read the fee schedule carefully
- Never re-checking figures — spreads, commissions and swap rates move; a model built six months ago on stale data isn't reliable today
- Comparing brokers on spread alone — always compare the full stack (spread + commission + swap) side by side, not a single line item
For a broker-by-broker breakdown methodology, PipTax's [brokers directory](/brokers/index.html) and [methodology page](/methodology.html) explain exactly how comparisons are built, so you're not relying on marketing copy.
Conclusion: treat your trade-cost model as a living document
A realistic trade-cost model isn't a one-off spreadsheet exercise — it's a working document you update whenever you change brokers, account types, or trading sessions. Rebuild it after any material shift in spreads, commission or swap, and always cross-check against live data via the [cost tool](/audit.html) rather than trusting numbers from memory. Trading remains risky regardless of how tight your cost model is — most retail accounts still lose money — but an honest trade-cost model at least ensures you're not losing to arithmetic you never checked.
Key takeaways
- A realistic trade-cost model separates spread, commission, swap, slippage and market impact rather than blending them into one guessed number
- Always pull live spread, commission and swap figures from a source like PipTax's cost tool rather than relying on marketing 'from' spreads
- Model both a typical-session cost and a stress-event cost, since news events and triple-swap days behave very differently from normal conditions
- Plug your blended cost per trade into your strategy's expectancy calculation — this is the step most traders skip before going live
- Compare brokers like Pepperstone and IG on the full cost stack, not spread alone, and treat the model as a living document you rebuild regularly
Frequently asked questions
- What's the difference between spread cost and slippage?
- Spread is the quoted gap between bid and ask at the moment you trade. Slippage is the difference between the price you requested and the price you were actually filled at, which happens because the market moves between order and execution. Both need modelling separately since they behave differently in fast markets.
- Should I model swap even if I'm a day trader who never holds overnight?
- If you genuinely never hold positions past the daily rollover cutoff, swap won't apply to you and you can leave it at zero. But double-check your actual habits against your intended rules — many 'day traders' occasionally hold overnight, and that's exactly when an unmodelled cost surprises you.
- How often should I rebuild my trade-cost model?
- Rebuild it whenever you switch broker or account type, and review it at least quarterly even if nothing's changed, since spreads and swap rates do move over time. Always pull fresh figures from a live source rather than reusing old numbers.
- Can a trade-cost model tell me which broker is 'best'?
- It can tell you which broker is cheaper for your specific pair, session and holding pattern, which is more useful than a general 'best broker' claim. Costs vary by account type and market conditions, so run the comparison for your own trading style using the cost tool rather than relying on a blanket recommendation.
- Do ECN accounts always work out cheaper once commission is included?
- Not always — it depends on your spread, size and frequency. ECN/raw accounts often have tighter spreads but add a per-lot commission, while standard accounts fold cost into a wider spread. The only way to know which is cheaper for you is to run both through a full trade-cost model rather than comparing headline spread numbers.