Home › FX Trading School › Pro
Reading Market Structure: Highs, Lows and Trends
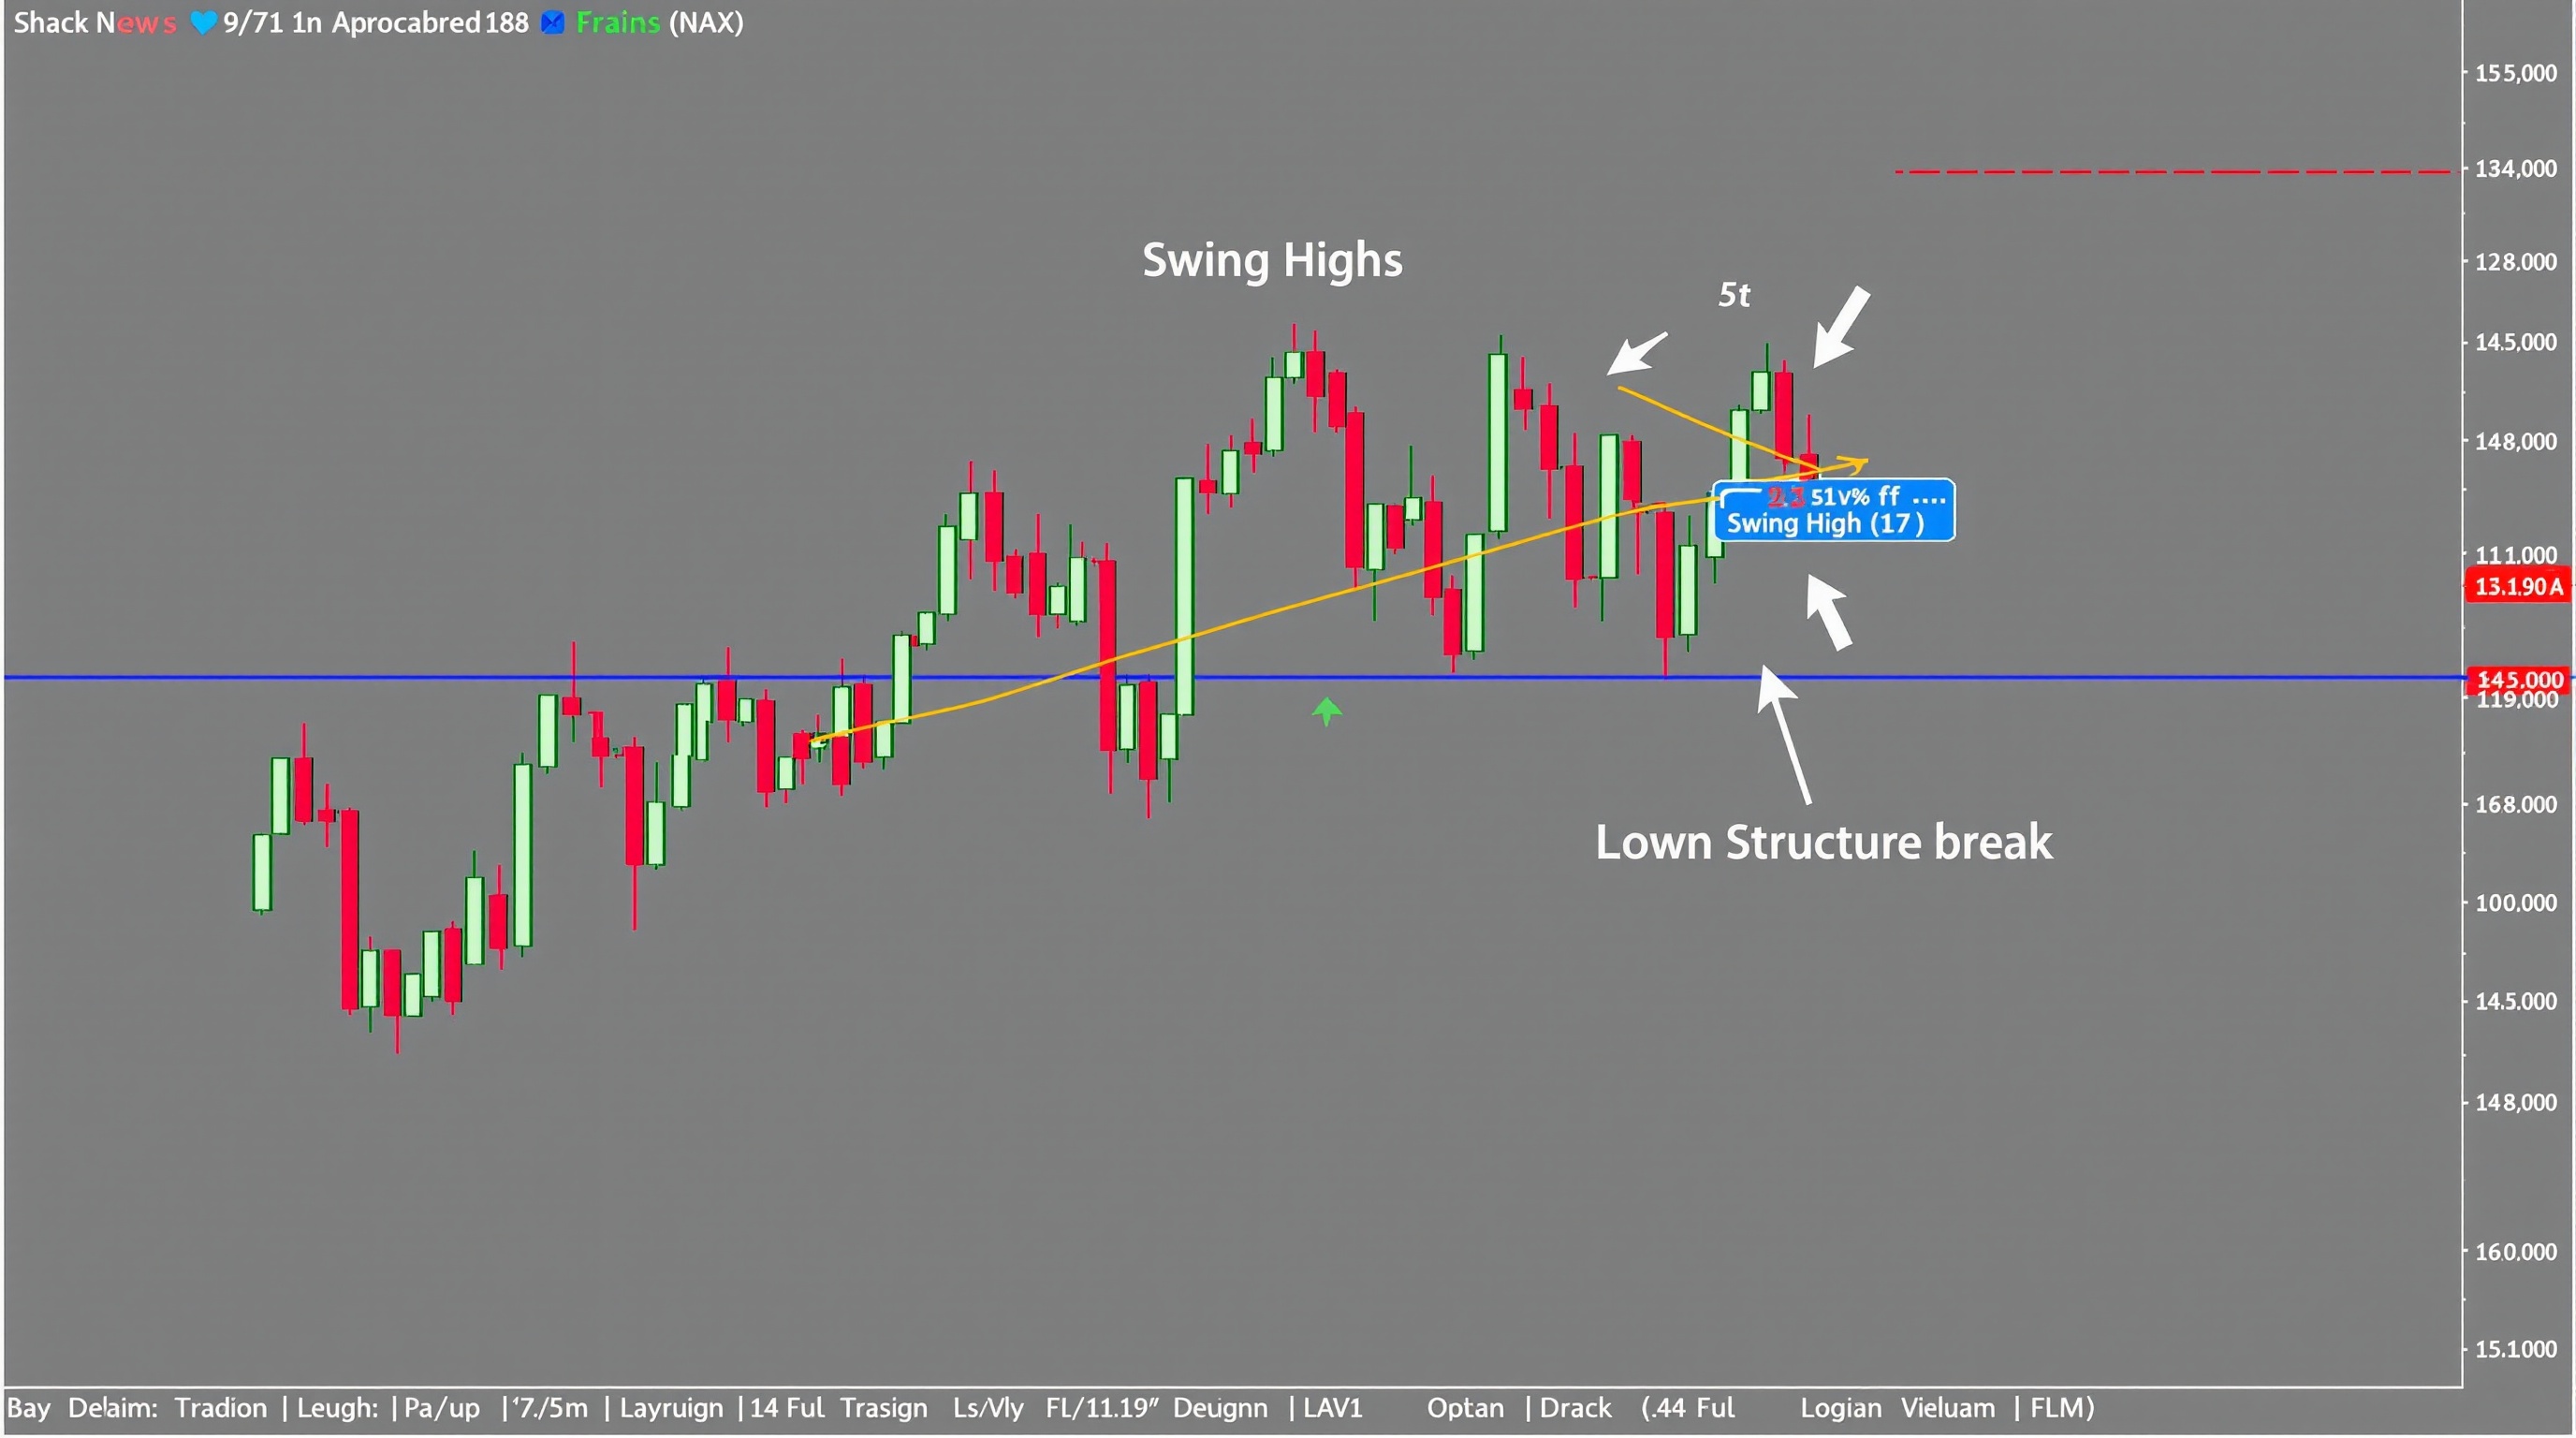
Market structure is the skeleton underneath every candlestick chart — the sequence of swing highs and swing lows that tells you whether a market is trending, ranging, or about to turn. This lesson is Module 11 of the PipTax FX Trading School, and it builds directly on Module 9 (support and resistance) and Module 10 (trend lines and channels), so if either of those feels shaky, go back before you continue.
By the end of this lesson you should be able to mark up a chart with swing points, name the current structure correctly, and identify the specific price level that would tell you the structure has changed — without relying on lagging indicators to do it for you.
What Market Structure Actually Means
Market structure is simply the pattern made by connecting a market's turning points. Every chart, on every timeframe, is built from swings — a swing high is a candle (or small cluster of candles) with lower highs on both sides of it; a swing low is a candle with higher lows on both sides. Everything else — trend lines, channels, chart patterns — is drawn on top of this skeleton.
There are only three structural states a market can be in:
- Uptrend — a sequence of higher highs (HH) and higher lows (HL)
- Downtrend — a sequence of lower highs (LH) and lower lows (LL)
- Range — swings that fail to make consistent new highs or lows, oscillating between a rough ceiling and floor
Reading structure correctly matters more than any single indicator because it's the context every other tool sits inside. A moving average crossover means something different in an established uptrend versus a choppy range. Support and resistance levels drawn in Module 9 only carry weight once you know whether the market respecting them is trending or ranging. Structure is the filter that tells you which signals to trust.
Marking Up Swing Highs and Swing Lows
Doing this by eye, consistently, is a skill worth drilling before you touch any automated swing-detection tool:
1. Pick a timeframe and stick to it. Structure on the 4-hour chart can look completely different from the 15-minute chart — that's normal, not a contradiction. 2. Scan left to right. Mark each obvious pivot where price clearly turned, ignoring single-candle wicks that don't represent a genuine change in direction. 3. Label each swing HH, HL, LH or LL relative to the one before it. 4. Check for consistency. A genuine trend shows a repeating pattern across at least 3–4 swings, not one lucky higher high in an otherwise messy chart.
A common beginner error is marking every minor wiggle as a swing point. Give yourself a rule — for example, a swing only counts if price moved a meaningful multiple of the recent average candle range — and apply it consistently rather than switching the goalposts to fit a bias you already have.
Higher Highs, Higher Lows: Confirming a Trend
An uptrend isn't confirmed by one higher high — it's confirmed by the pattern repeating. Watch for:
- Each pullback holding above the previous swing low (the HL)
- Each rally clearing the previous swing high (the HH)
- Pullbacks that are proportionate — a healthy trend rarely retraces so deep that it threatens the last HL
The moment a pullback fails to hold above the prior swing low, you don't automatically have a reversal — you have a warning. This is the difference between structure reading and guessing: you're watching for evidence, not predicting.
Spotting a Structure Break (Trend Reversal Signals)
A break of structure (BOS) is the first objective clue that a trend may be changing. In an uptrend, this happens when price makes a lower low — breaking below the most recent HL — rather than the expected higher low.
Key points on structure breaks:
- One break isn't proof of reversal. It can also just start a range.
- Confirmation comes from the next swing. If price then fails to make a new higher high and instead prints a lower high, you now have LH + LL — the beginning of a genuine downtrend.
- Volume and momentum context help but aren't required to define structure itself — structure is a price-only concept.
- Higher timeframes carry more weight. A structure break on the 5-minute chart inside a strong daily uptrend is a very different event to a break on the daily chart itself.
This is also where risk management earns its keep: a structure break is a natural, logical place to move a stop loss or tighten it, because it marks the level at which your original trend thesis is proven wrong.
Using Multiple Timeframes to Read Structure
Professional structure reading is rarely done on one chart in isolation:
| Timeframe role | Purpose | |---|---| | Higher (e.g. Daily/4H) | Establish the dominant trend or range | | Middle (e.g. 1H) | Identify the current swing sequence and recent BOS | | Lower (e.g. 15M/5M) | Time entries within the higher-timeframe structure |
The practical workflow: identify the dominant structure on the higher timeframe first, then only take structure-based entries on the lower timeframe that agree with it. Fighting the higher-timeframe trend on a lower-timeframe structure break is a common way traders get caught in noise.
Practising This on a Real Platform
You don't need special tools to practise this — a demo account on any regulated broker's charting package works. On IG's own platform, you can use the built-in drawing tools to mark swings directly and save chart templates per timeframe. On Pepperstone's MetaTrader terminals, the same marking-up can be done manually with horizontal lines and trend lines, and MetaTrader's multi-chart layouts make the multi-timeframe check straightforward.
A sensible practice routine:
- Mark up 20–30 historical swings on a demo chart before risking anything live
- Note every structure break and whether it led to a reversal or just a range
- Review your own consistency — are you labelling swings the same way each time?
None of this removes the underlying risk of trading — most retail accounts still lose money, and structure reading is a skill that reduces guesswork, not a guarantee of profitable trades.
Bringing It Together
Reading market structure well means you can look at any chart, on any timeframe, and immediately state whether it's trending up, trending down, or ranging — and know exactly what price level would prove you wrong. That's a far more durable skill than memorising indicator settings, because market structure is the same across every pair and every broker's feed.
Once this is second nature, the next logical step in the PipTax FX Trading School is combining structure with support and resistance zones to build actual trade plans — but that's Module 12. For now, focus on consistent swing labelling and honest structure-break identification before adding anything else on top. And remember: whatever edge you build on structure, your broker's spreads and execution still eat into it — check that with the cost tool before you go live.
Key takeaways
- Market structure is built from swing highs and swing lows — everything else (trend lines, S/R, patterns) is drawn on top of it
- An uptrend needs a repeating pattern of higher highs and higher lows, not just one strong rally
- A break of structure is a warning, not proof — wait for the next swing to confirm a genuine reversal
- Check the higher timeframe's structure first, then use lower timeframes only to time entries that agree with it
- Practise marking up swings manually on a demo account (IG or Pepperstone's MetaTrader) before trading it live
- Structure reading reduces guesswork but doesn't remove risk — check real trading costs with the PipTax cost tool
Frequently asked questions
- What's the difference between a swing high and resistance?
- A swing high is a single structural pivot point on the chart. Resistance is a zone formed when multiple swing highs cluster around a similar price. Every resistance level starts life as a swing high, but not every swing high becomes resistance.
- How many swings do I need before I can call something a trend?
- There's no strict rule, but most structure traders want to see at least two or three consecutive higher-highs/higher-lows (or lower-highs/lower-lows) before treating it as an established trend rather than noise.
- Does a break of structure always mean the trend has reversed?
- No. A single break of structure is a warning sign, not confirmation. You typically want the next swing to also fail in the new direction (e.g. a lower high after a lower low) before treating it as a genuine reversal.
- Can I read market structure the same way on every timeframe?
- The method is identical, but the swings themselves will differ — a clear uptrend on the 15-minute chart can sit inside a range on the daily chart. Always check the higher timeframe for context before trading a lower-timeframe structure.
- Do I need special software to mark up market structure?
- No. Basic drawing tools on IG's own platform or Pepperstone's MetaTrader terminals are enough to mark swing highs, swing lows and trend lines manually, which is also the best way to actually learn the skill.