Home › FX Trading School › Intermediate
The MACD Indicator Explained: A Trader's Guide
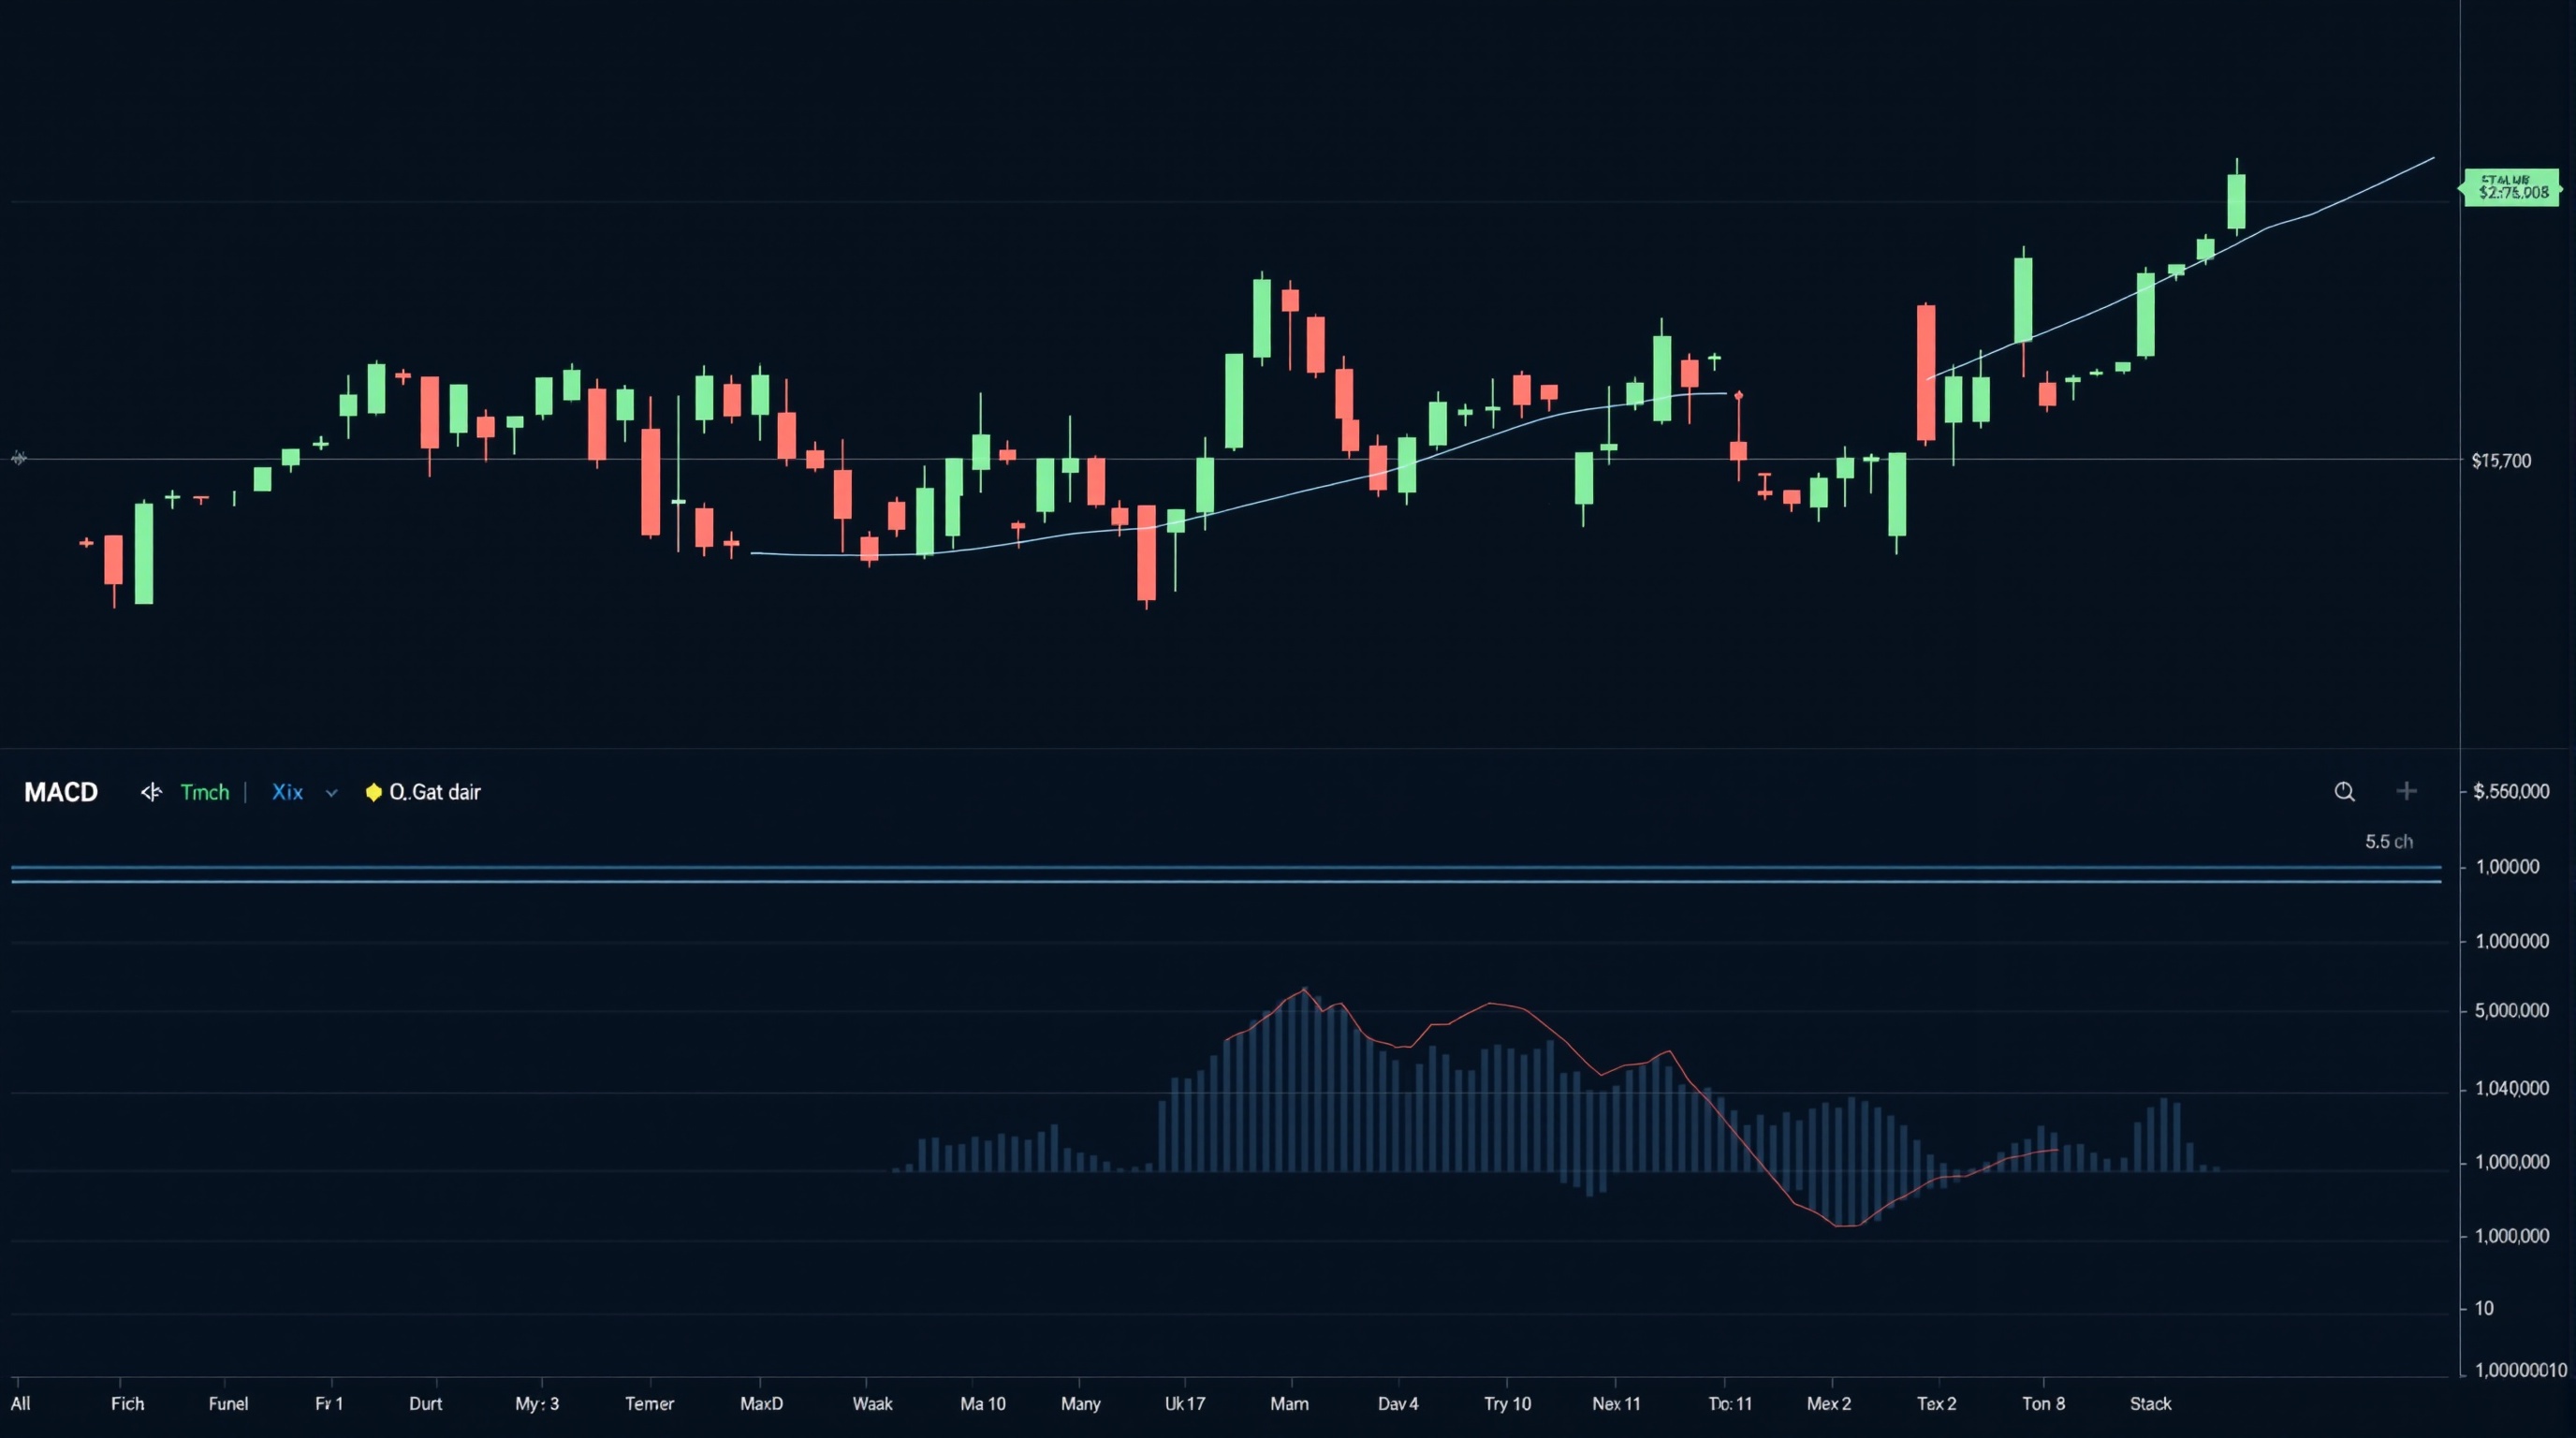
The MACD indicator is one of the most widely used momentum tools in forex trading, and if you've completed earlier modules on moving averages and support/resistance, this lesson builds directly on those ideas by showing how momentum can confirm or contradict what price is doing. This is Module 6 of the PipTax FX Trading School, and it's aimed at traders who already understand basic chart reading and want a proper, practical grip on MACD before adding it to a strategy.
What the MACD Indicator Actually Is
MACD stands for Moving Average Convergence Divergence. Despite the intimidating name, it's built from parts you already know if you've studied moving averages:
- MACD line – the difference between a 12-period EMA and a 26-period EMA of price.
- Signal line – a 9-period EMA of the MACD line itself.
- Histogram – the gap between the MACD line and the signal line, plotted as bars.
When the 12-EMA is above the 26-EMA, the MACD line sits above zero, meaning short-term momentum is stronger than the longer-term trend. When it's below zero, the opposite is true. The histogram simply visualises how far apart the two lines are — it grows when momentum is accelerating and shrinks when it's fading.
It's worth being clear about what MACD is not: it's not a price target, not an overbought/oversold oscillator like RSI, and not a standalone entry system. It's a momentum readout, and like any indicator built from moving averages, it lags price. That lag is the trade-off for smoothing out noise.
Reading MACD Crossovers
The most common MACD signal is a crossover:
- Bullish crossover – the MACD line crosses above the signal line, suggesting upward momentum is building.
- Bearish crossover – the MACD line crosses below the signal line, suggesting downward momentum is building.
A crossover above the zero line carries more weight than one below it, because it means the shorter EMA has also flipped above the longer EMA — the broader trend context agrees with the momentum shift.
Practical points for intermediate traders:
1. Don't trade every crossover. In a ranging market, MACD will whipsaw constantly, throwing out false signals. 2. Check the zero line. A crossover happening well above or below zero is often a continuation signal, not a reversal. 3. Watch histogram size. A crossover after a large histogram spike (exhausted momentum) behaves differently to one after a small, tight histogram. 4. Combine with structure. A bullish crossover into a known resistance zone is weaker than one with clear room to run.
MACD Divergence: An Early Warning, Not a Signal
Divergence is where price and MACD disagree:
- Bearish divergence – price makes a higher high, but MACD makes a lower high. Momentum is fading even as price pushes on.
- Bullish divergence – price makes a lower low, but MACD makes a higher low. Selling pressure is weakening even as price falls further.
Divergence is popular because it can flag exhaustion before an obvious reversal shows up on the price chart. But it comes with a real caveat: divergence can persist for a long time in a strong trend. Momentum can weaken gradually over many weeks while price keeps grinding higher. Treat divergence as a prompt to tighten risk management or look for confirming price action (like a break of a trendline), not as a standalone sell or buy trigger.
Setting Up MACD on Your Platform
Both MetaTrader and IG's own platform ship MACD as a standard indicator, so you don't need anything custom:
| Platform | Where to find it | |---|---| | MetaTrader 4/5 (e.g. on Pepperstone's MT4/MT5 servers) | Insert → Indicators → Oscillators → MACD | | IG platform | Chart tools → Indicators → Momentum → MACD | | TradingView | Indicators search bar → "MACD" |
Default settings are 12, 26, 9 — leave these alone until you've backtested a change. Adjusting the periods (say, shortening to 5, 13, 6 for faster signals) increases sensitivity but also increases false signals, so any change needs testing on your specific pair and timeframe, not just a general assumption that "faster is better."
Building a Simple MACD-Based Workflow
A workable, honest process for an intermediate trader might look like this:
1. Identify the higher-timeframe trend using price structure or a longer moving average. 2. Wait for a MACD crossover in the direction of that trend — this filters out a large share of false counter-trend signals. 3. Check the histogram — is momentum genuinely building, or is this a weak, fading crossover? 4. Look for a confirming price action trigger (a break of a short-term high/low, a candlestick pattern) before entering. 5. Set a stop based on structure, not on the indicator itself.
MACD works best as a filter that narrows down which price-action setups are worth taking, rather than as the sole reason to click buy or sell.
Costs, Realism, and the Limits of MACD
No indicator, including MACD, changes the arithmetic of trading costs. A clean bullish crossover on EUR/USD means little if the spread and any commission consume a large share of your expected move, especially on shorter timeframes where MACD signals are more frequent but individual moves are smaller. Before sizing a MACD-based trade, run the setup through PipTax's cost-impact tool to see what spread and commission actually take off your target, and check current live pricing on the brokers page rather than assuming a number.
It's also worth being blunt: most retail accounts lose money trading forex, and no combination of indicators removes that risk. MACD is a useful, well-established tool for reading momentum — it is not an edge on its own, and treating it as one is how good technical analysis turns into poor trading decisions.
Conclusion: Where MACD Fits in Your Toolkit
The MACD indicator is a solid, transparent way to read momentum shifts, crossovers, and early signs of exhaustion via divergence — but it lags price, gives false signals in ranging markets, and needs to be combined with trend context, price structure, and realistic cost awareness. Used as one part of a broader process rather than a standalone trigger, it earns its long-standing place in most traders' toolkits. For the next step, head back to the FX Trading School index to continue through Module 6, or run a live setup through the cost audit tool before you risk real money on it.
Key takeaways
- The MACD indicator is built from two moving averages and shows momentum, not price level, so it works best alongside support/resistance or trend analysis.
- A MACD crossover (MACD line crossing the signal line) is the most common trigger, but it lags price and should not be traded in isolation.
- MACD divergence — where price makes a new high/low but MACD doesn't — is a useful early warning of fading momentum, not a guaranteed reversal signal.
- The histogram shows the gap between the MACD and signal lines, so a shrinking histogram often precedes a crossover.
- Default settings (12, 26, 9) work fine on most timeframes, but intermediate traders should test settings against their own chosen pairs and timeframes before relying on them.
- MACD signals arrive after cost and slippage are applied to your account, so check your true entry cost with PipTax's cost tool before sizing any MACD-based trade.
Frequently asked questions
- What does MACD stand for and what does it measure?
- MACD stands for Moving Average Convergence Divergence. It measures momentum by tracking the relationship between two exponential moving averages (EMAs) of price, usually a 12-period and a 26-period EMA. It doesn't tell you the price level, only whether momentum is building or fading.
- Is MACD a leading or lagging indicator?
- MACD is a lagging indicator because it's built from moving averages, which themselves lag price. Crossovers confirm a move that's often already underway rather than predicting one in advance. Traders use it to confirm trend strength, not to catch the very first tick of a move.
- What is MACD divergence and does it guarantee a reversal?
- Divergence is when price makes a new high or low but the MACD doesn't confirm it with a matching high or low. It signals that momentum is weakening even as price extends, but it's a warning sign, not a guarantee — divergence can persist for a long time before price actually turns.
- Can I use MACD on any timeframe or currency pair?
- Yes, MACD works on any timeframe from one-minute charts to weekly charts, and on any pair. However, the standard 12/26/9 settings were designed with daily charts in mind, so on very short timeframes or illiquid pairs you may want to test different settings before trusting the signals.
- Does my broker's spread affect how well MACD signals perform?
- Yes. A MACD crossover might look clean on the chart, but if the spread and any commission eat a large chunk of your target move, the signal isn't worth trading. Use PipTax's cost-impact tool to see how spread and commission affect a typical MACD-based trade before you commit.