Home › FX Trading School › Beginner
How to Read an Economic Calendar (Beginner Guide)
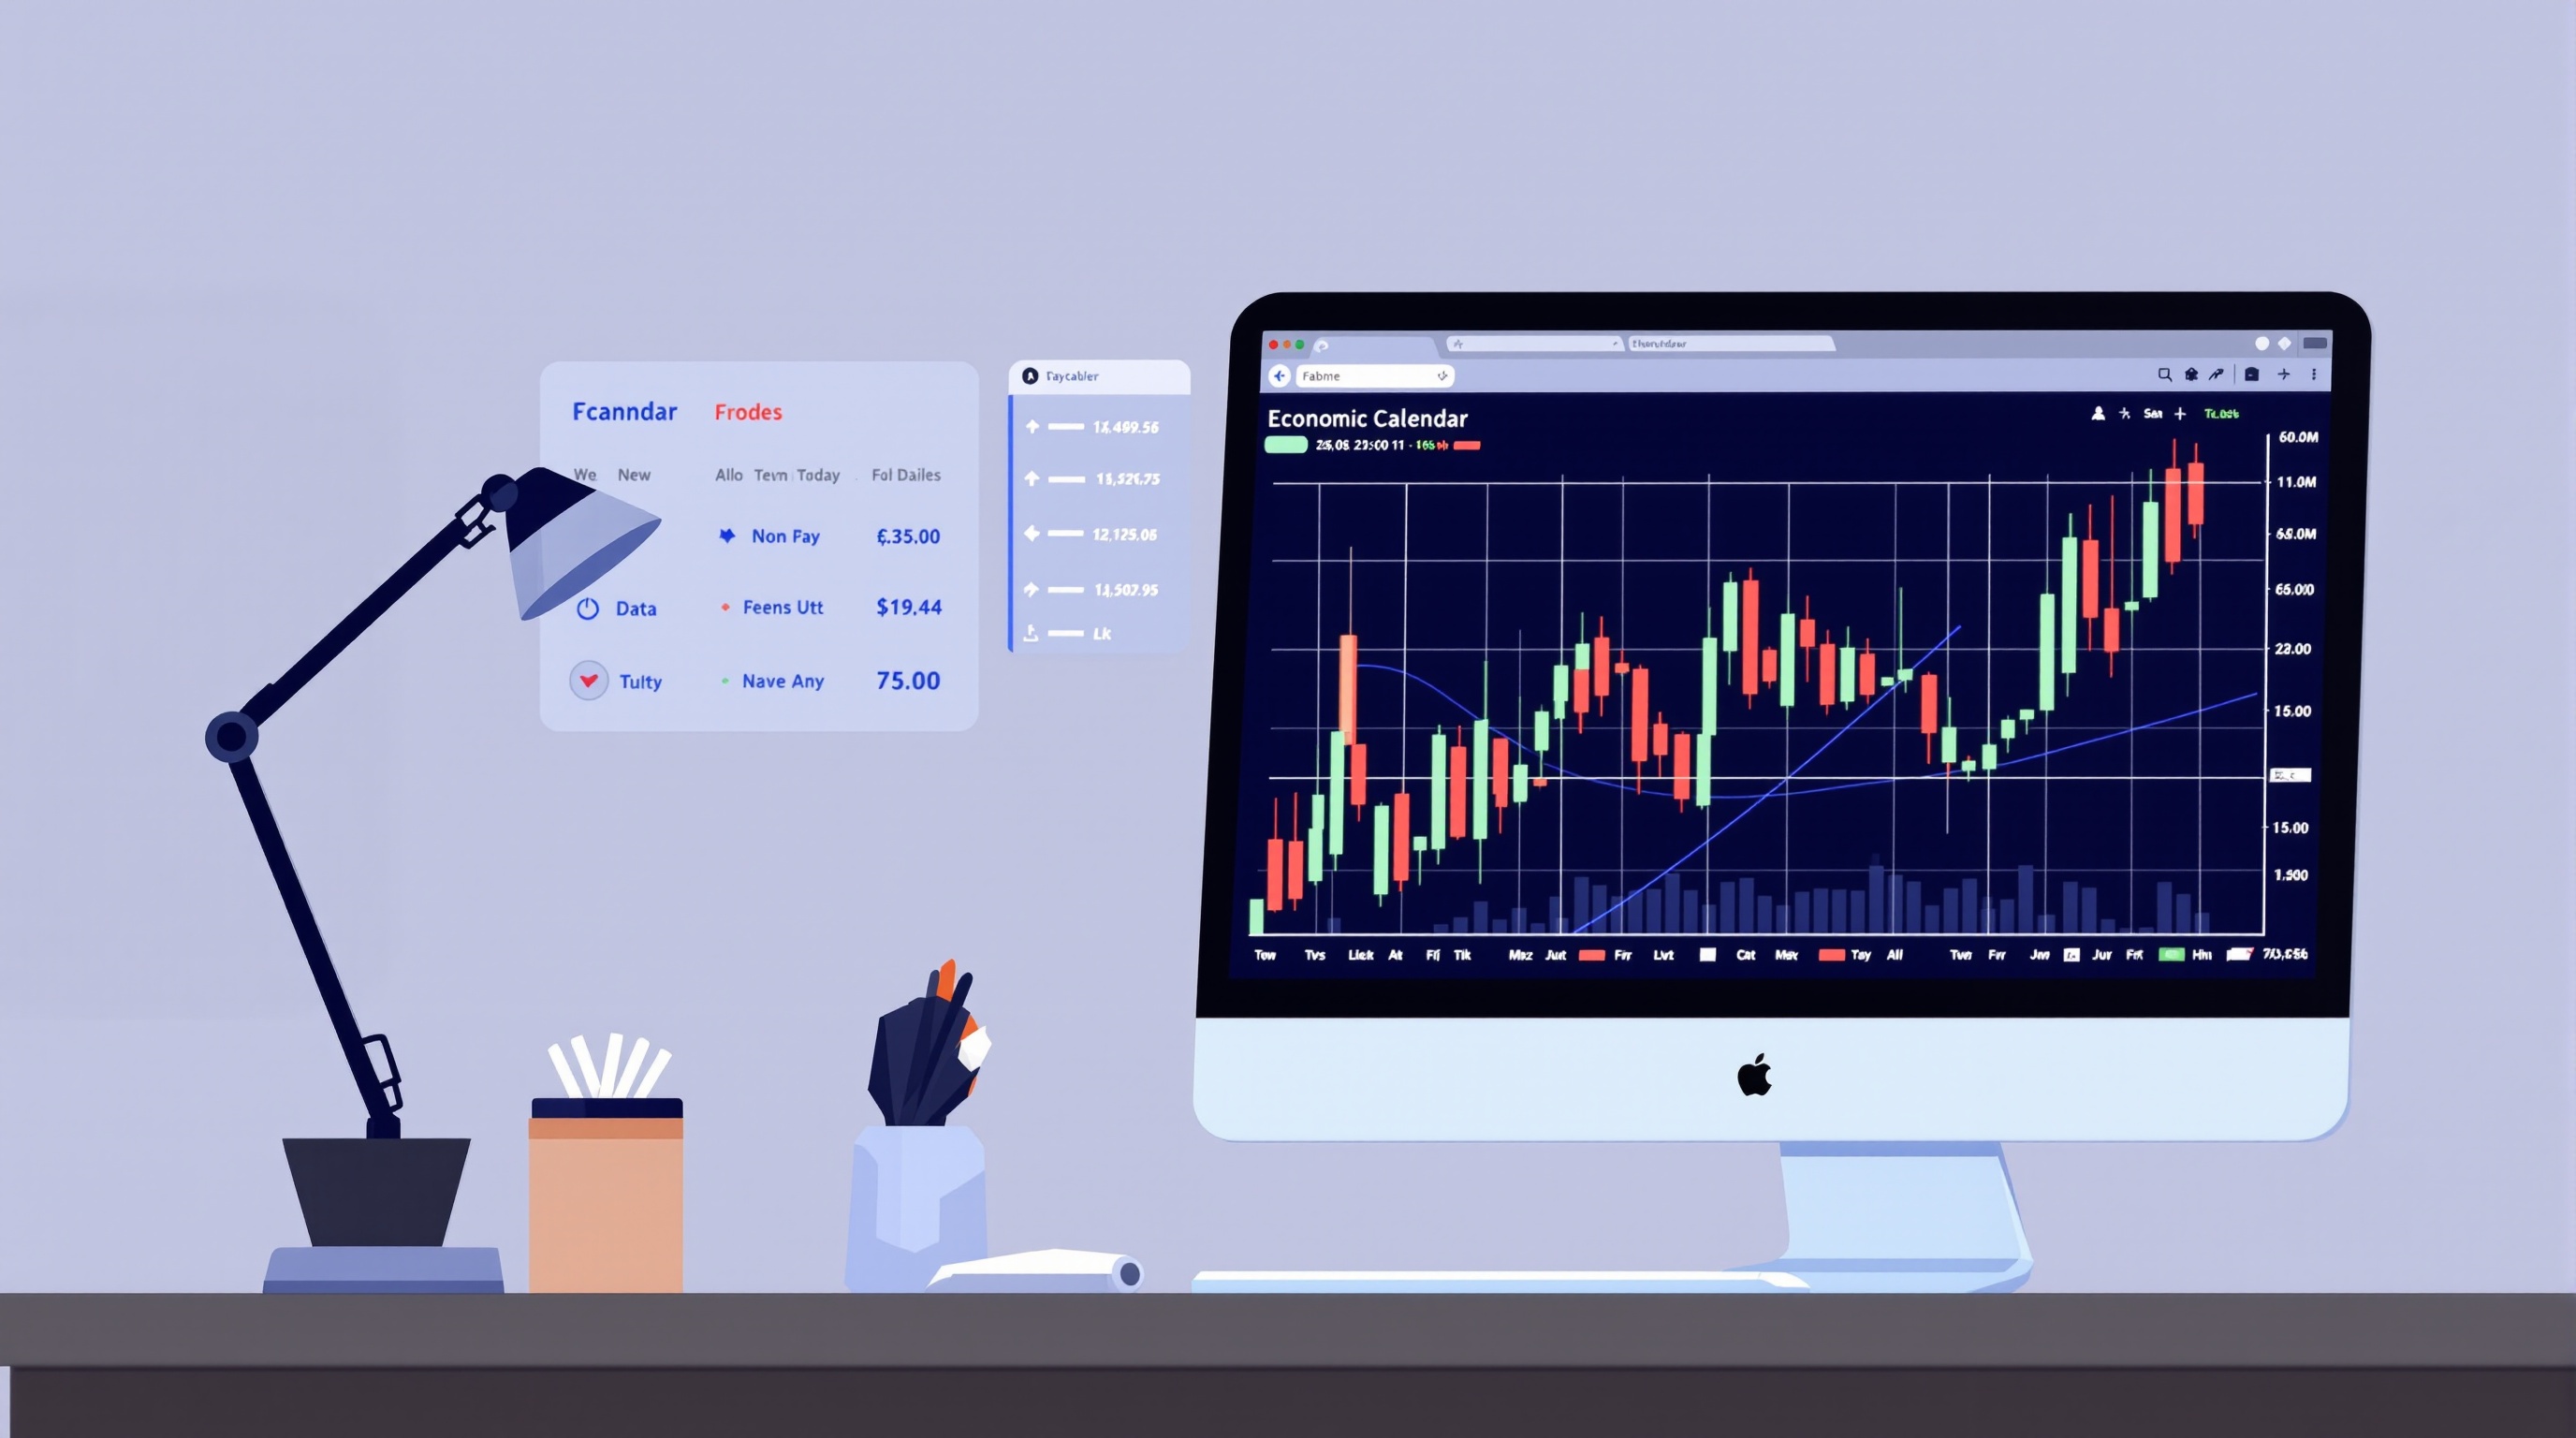
Learning how to read an economic calendar is one of those beginner skills that quietly separates traders who get blindsided by news spikes from those who plan around them. It's not glamorous, but it's practical — and this lesson gives you a workflow you can use before your next trading session.
This is Module 5 of the PipTax FX Trading School, on the market. It builds on earlier lessons about what moves currency pairs and how spreads widen around volatility (see Module 5's earlier sections if you haven't read them yet). If you skipped straight here, that's fine — this lesson stands on its own, but it'll make more sense once you understand why prices move at all.
What an economic calendar actually is
An economic calendar is a schedule of upcoming data releases and events that can move markets — interest rate decisions, employment figures, inflation reports, GDP numbers, and central bank speeches. Most brokers and financial sites publish one for free, including Pepperstone and IG on their platforms and websites.
Each entry typically shows:
- Date and time of the release (usually in your local time zone, but always check)
- Country/currency affected — a US release mostly moves USD pairs, a Eurozone release mostly moves EUR pairs
- Event name — e.g. "Non-Farm Payrolls" or "CPI y/y"
- Impact rating — usually shown as low, medium or high (often colour-coded, or 1–3 stars/bulls)
- Previous, forecast, and actual figures — what the number was last time, what analysts expect, and (once released) what it actually came in at
The calendar doesn't tell you which way price will move. It tells you when uncertainty is scheduled to spike — which is exactly what a beginner needs to know before placing or holding a trade.
Why beginners should care about this
New traders often get caught out not because their analysis was wrong, but because they didn't know a major release was due. Understanding the calendar helps you:
- Avoid unpleasant surprises — a trade that looks fine at 1:25pm can look very different two minutes after a 1:30pm US data release
- Understand why spreads widen — liquidity often thins right before high-impact news, and spreads can widen sharply as a result; this is a cost, not a conspiracy
- Plan around events rather than being ambushed by them — you might choose to close a position, reduce size, or simply not open a new trade in the minutes around a big release
- Make sense of sudden volatility — if GBP/USD suddenly jumps 40 pips for no obvious chart reason, the calendar is usually the first place to look for an explanation
None of this means you should trade the news itself as a beginner — that's a more advanced, higher-risk approach. At this stage, the calendar is mainly a risk-management tool, not a signal generator.
How to read the impact rating properly
Impact ratings are a guide, not a guarantee. A "high impact" label means the release *has the potential* to move markets significantly — not that it always will, and not that "low impact" events never surprise anyone.
A practical way to use the rating system:
| Impact level | What it usually means | Beginner action | |---|---|---| | High | Major releases (e.g. central bank rate decisions, NFP, CPI) — can cause sharp, fast moves | Know the exact time; consider reducing exposure beforehand | | Medium | Notable data (e.g. retail sales, PMI surveys) — can move price, less predictably | Be aware, don't necessarily act | | Low | Minor data or routine speeches — rarely moves price alone | Note it, but no action usually needed |
Remember that impact also depends on which pairs you're trading. A high-impact US release matters a lot if you hold EUR/USD, but does nothing to AUD/NZD. Always check the currency tag, not just the impact colour.
Reading forecast vs. actual — the part that really matters
The single most useful skill in reading a calendar is comparing the forecast figure to the actual figure once it's released. Markets tend to react to the *surprise*, not the absolute number.
- If actual data matches the forecast closely, the reaction is often muted
- If actual data beats or misses the forecast by a wide margin, that's usually when you see the sharp move
- The "previous" figure gives context — is this number better or worse than last time, and is there a trend?
For example, if forecast NFP is 180,000 jobs and actual comes in at 240,000, that's a significant positive surprise for USD — even though 240,000 alone might sound like "just a number" without the comparison. This is why experienced traders watch the forecast column as closely as the actual one.
Building a simple weekly routine
You don't need to obsess over the calendar daily. A simple beginner routine:
1. Once a week (e.g. Sunday evening or Monday morning), scan the week ahead and note high-impact events for the currencies you trade 2. Each morning, check if anything high-impact is scheduled that day and roughly what time 3. Before entering a trade, glance at the calendar for the next few hours — is there a release coming that could disrupt your setup? 4. After a surprise price move, check the calendar first before assuming something is "wrong" with your chart or broker
This routine takes minutes and prevents a lot of confusion.
Calendar events and your trading costs
This is where the calendar connects directly to something practical: spreads and slippage often widen around high-impact news, because liquidity providers pull back and volatility increases. This is a real cost, and it varies broker to broker and moment to moment — nobody can honestly promise you a fixed spread during a central bank announcement.
Rather than guessing, use PipTax's [cost audit tool](/audit.html) to see how your actual trading costs behave, and compare broker approaches on the [broker comparison pages](/brokers/index.html) — for instance, how Pepperstone's execution on its MetaTrader servers or IG's own platform typically handle busy periods. For understanding how we calculate and compare these costs, see our [methodology](/methodology.html).
Conclusion: making the calendar part of your routine
Reading an economic calendar isn't about predicting the future — it's about knowing when uncertainty is scheduled, so you're not caught off guard. As a beginner, treat the calendar as a risk-management habit: check impact ratings, watch forecast-versus-actual once data lands, and build a simple weekly check into your routine. Get comfortable with how to read an economic calendar now, and it'll make every later lesson on volatility and risk far easier to apply.
Key takeaways
- An economic calendar lists scheduled data releases and events, with a country, time, and impact rating — it tells you when volatility is likely, not which direction price will move
- Beginners should treat the calendar mainly as a risk-management tool: know what's coming, don't necessarily trade the news itself
- Markets react to surprises — comparing the forecast figure to the actual released figure matters more than the raw number
- Spreads often widen around high-impact releases due to thinning liquidity; check the cost audit tool for how this affects your account
- A simple weekly-plus-daily check of the calendar takes minutes and prevents most news-related surprises
Frequently asked questions
- What is the best economic calendar for forex trading?
- Most FCA-regulated brokers, including Pepperstone and IG, provide a free economic calendar on their platform or website. There's no single 'best' one for beginners — the important thing is checking it regularly and understanding the impact ratings and time zone settings.
- Should beginners trade during high-impact news events?
- Generally no. High-impact releases can cause sharp, fast price moves and wider spreads, which is riskier for beginners still learning position sizing and order execution. At this stage, use the calendar to manage risk around news rather than to trade it directly.
- What does 'forecast vs actual' mean on an economic calendar?
- The forecast is what analysts expect a data release to show; the actual is the real figure once published. Markets tend to move based on how far the actual differs from the forecast — a big surprise usually causes a bigger price reaction than the raw number alone would suggest.
- Why do spreads widen around economic calendar events?
- Liquidity providers often reduce their quoted size or widen their prices around high-impact releases because the outcome is uncertain and volatility risk increases. This is a normal market mechanic, not something specific to one broker — check PipTax's cost audit tool to see how it affects your own trading.
- How often should I check the economic calendar?
- A simple beginner routine is a weekly scan for major events on the currencies you trade, plus a quick daily check each morning and before entering any new trade.