Home › FX Trading School › Intermediate
How to Backtest a Strategy Manually
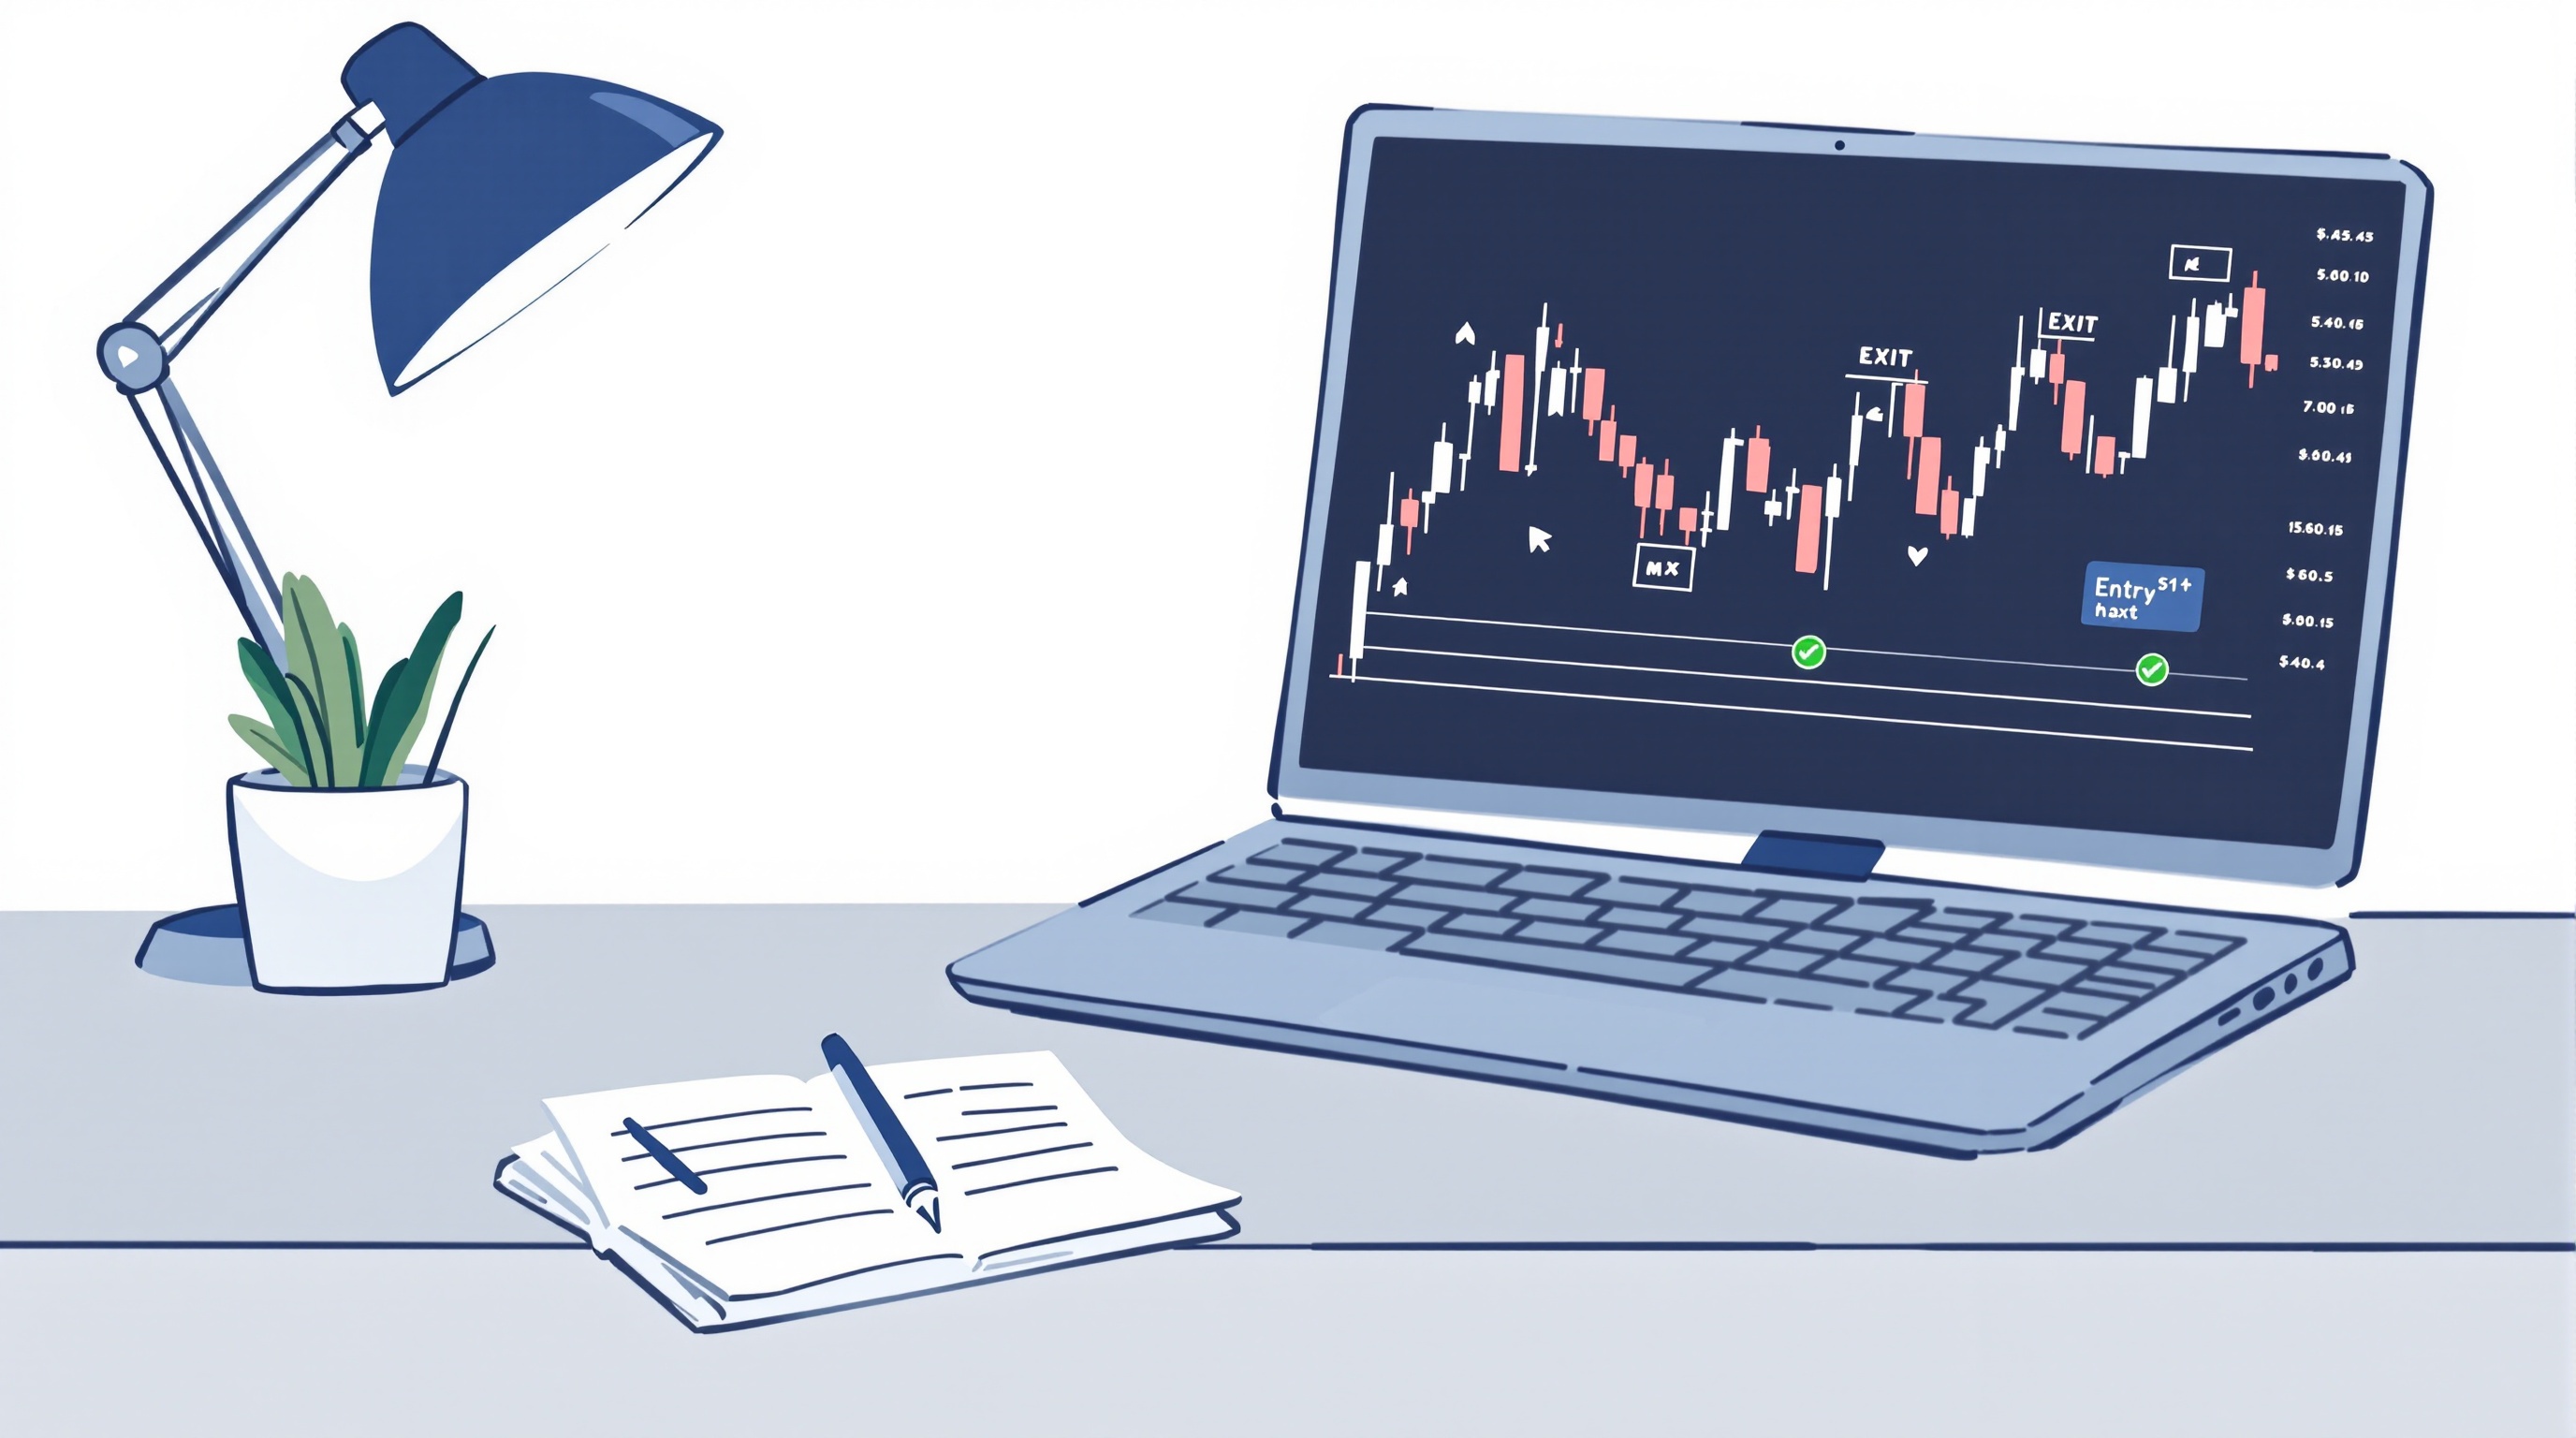
If you want to know whether a strategy has any edge before you risk real money, you need to backtest a strategy manually — working through historical charts bar by bar, applying your rules exactly as you would in real time, and recording what happens. This lesson is part of Module 10 · Craft, and it assumes you've already worked through defining a strategy's entry and exit rules earlier in the course. If your rules aren't written down yet, go back and do that first — you can't test what isn't specified.
What Manual Backtesting Actually Means
Manual backtesting is the process of scrolling a chart back to a past date, then moving forward candle by candle, deciding at each point whether your rules produce a trade — without knowing what comes next. It's different from:
- Eyeballing a chart — glancing at a year of price action and spotting obvious swings after the fact. This is nearly useless because hindsight makes every setup look clean.
- Automated backtesting — coding your rules into an Expert Advisor or script and letting the platform run thousands of trades in seconds. Useful, but it demands rules precise enough to programme, and it hides the "feel" of live decision-making.
Manual testing sits between the two. It's slow — expect an hour or more per 100 candles when you're being careful — but it's the only method that replicates the actual experience of making a decision with an unknown future. For discretionary or semi-discretionary strategies (ones involving judgement calls about candle shape, news proximity, or multiple timeframes), manual testing is often the only honest option available.
Setting Up the Test Properly
Before you touch a chart, get the boring admin right, because a sloppy setup invalidates everything downstream:
1. Pick one instrument and one timeframe. Testing EUR/USD on the 1-hour chart is a different test to GBP/USD on the 4-hour — don't mix results together. 2. Choose a date range with variety. Include at least one clear trend, one range-bound period, and one volatile news-driven stretch (e.g. around an interest rate decision). 3. Hide the future. Use a vertical trend line to mark "now" and drag it forward one candle at a time, or use your platform's strategy tester in manual step mode. Never scroll ahead and back. 4. Fix your position size rule in advance — a fixed percentage of account equity per trade is the standard approach, so results are comparable trade to trade. 5. Decide your spread and commission assumption now, not after you've seen the results (more on this below).
Skipping any of these steps means you're not really testing — you're just admiring a chart.
Applying Your Rules Bar by Bar
This is the actual mechanical process, and it should feel almost boring if you're doing it right:
- Move the chart forward one candle.
- Ask: does this candle complete a valid setup under my written rules?
- If no, move forward again.
- If yes, mark the theoretical entry, stop-loss and take-profit exactly as your rules define them — not where you wish they'd be.
- Continue forward candle by candle until the stop or target is hit, then record the outcome before looking for the next setup.
The discipline here is refusing to adjust your stop or target with hindsight once price has moved. If your rule says stop at 20 pips, that's the stop — even when you can see three candles later that price reversed just short of it. That temptation to "adjust slightly" is exactly what inflates backtest results and gives false confidence.
Logging Results Honestly
A backtest without a log is just an impression. Use a simple spreadsheet with, at minimum:
| Column | Purpose | |---|---| | Date/time of entry | Lets you check clustering around news events | | Direction | Long or short | | Entry, stop, target prices | Raw numbers for verification | | Result (R-multiple) | Profit/loss as a multiple of risk, not just pips | | Rule adherence (yes/no) | Flags trades where you bent the rules | | Notes | Anything unusual about market conditions |
Logging every single signal — including ones you'd have skipped in real life due to fear or doubt — matters more than it sounds. If you quietly drop the losers, you've built a spreadsheet of survivorship bias, not a strategy record.
Accounting for Real Trading Costs
This is where most manual backtests fall apart. Historical chart data typically shows mid-price candles with no spread, no commission, and no slippage baked in. Your backtest will look better than live trading will ever feel unless you correct for this:
- Subtract a realistic spread from every entry and exit, based on the instrument and session (spreads widen around rollover and news).
- Add a commission figure if your account type charges one — common on ECN/raw-spread accounts at brokers like Pepperstone.
- Consider slippage on stop-losses during fast markets; a backtest assumes perfect fills, live trading often doesn't deliver them.
Because live costs vary by broker, account type and even time of day, don't guess. Run your instrument and expected trade frequency through PipTax's cost tool at /audit.html to see a realistic cost estimate, and compare account types on the /brokers/index.html page — Pepperstone's MetaTrader servers and IG's own platform have different cost structures worth checking side by side.
Reading Your Results Without Fooling Yourself
Once you've got 50-100 logged trades, calculate:
- Win rate — percentage of trades hitting target vs stop.
- Average R-multiple — average result expressed as a multiple of risk, which matters more than win rate alone.
- Expectancy — (win rate × average win) minus (loss rate × average loss), the single number that tells you whether the system has a mathematical edge before costs.
- Maximum consecutive losses — tells you what drawdown you need to be psychologically and financially prepared for.
A positive expectancy before costs doesn't guarantee a positive expectancy after real spreads and commissions are deducted — thin edges can vanish entirely once costs are applied. This is exactly why the cost check isn't optional.
From Backtest to Demo Trading
A clean manual backtest is a hypothesis, not a licence to go live with size. The sensible next step is demo trading the same rules forward in real time, where you can't hide the future even by accident, followed by a small live position size to confirm the psychological side holds up too. Our methodology page at /methodology.html explains how PipTax structures cost comparisons if you want to see the same rigour applied to broker selection as you're now applying to your own strategy.
Learning to backtest a strategy manually is one of the most useful habits in the PipTax FX Trading School — it turns a hunch into a documented, testable process, and it forces the kind of honesty that live trading demands anyway. Treat every result as provisional, keep your logs, and always check real costs before scaling up. For the next module, head back to /school/index.html to continue the course.
Key takeaways
- Manual backtesting means moving through historical charts bar-by-bar and only trading rules you'd have known at the time — no hindsight peeking.
- You need a fully written rule set before you start, covering entries, stops, targets, position size and what counts as a valid setup.
- Log every trade in a simple spreadsheet with entry, exit, R-multiple, and a note on rule adherence — this is what turns testing into evidence.
- A sample of 50-100 trades across varied market conditions is the rough minimum before you can draw any conclusion.
- Manual backtests ignore real spreads, commissions and slippage, so always sanity-check results with PipTax's cost tool before sizing up.
- Backtesting builds on having a clearly defined strategy first — if your rules aren't written down, write them down before you start.
Frequently asked questions
- How many trades do I need before trusting a manual backtest?
- There's no magic number, but fewer than 50 trades tells you very little — you could just be looking at a lucky or unlucky stretch. Most traders aim for 50-100 trades across at least two or three different market conditions (trending, ranging, volatile) before drawing conclusions. Even then, treat the result as a hypothesis to confirm in demo or small-size live trading, not a guarantee.
- Can I manually backtest on MetaTrader 4 or 5?
- Yes. Both platforms let you open a chart, scroll back to a start date, and step forward bar by bar using the strategy tester in offline mode, or simply by manually scrolling and hiding future price action with a vertical line or a second monitor. Pepperstone and IG both offer MetaTrader access, so the mechanics are the same regardless of broker — it's your rule discipline that matters, not the platform.
- Is manual backtesting better than automated backtesting?
- They serve different purposes. Manual backtesting is slower but forces you to genuinely understand your setups and practice decision-making under uncertainty, which is valuable for discretionary strategies. Automated backtesting (via an EA or coded script) is faster and better suited to fully mechanical rules. Many traders do both: manual first to build feel, automated later to test at scale.
- Do manual backtest results include spreads and commissions?
- Not unless you add them in yourself. Historical charts typically show mid-price candles, so your backtest will overstate results unless you manually subtract a realistic spread and commission from each trade. Use PipTax's cost tool to check current live costs at brokers like Pepperstone and IG so your backtest isn't quietly assuming a free lunch.
- What's the biggest mistake traders make when backtesting manually?
- Hindsight bias — unconsciously using knowledge of what happened next to justify taking a trade. This is why scrolling forward one bar at a time, rather than looking at a full chart and picking out obvious swings, is so important. The second biggest mistake is not writing down losing trades honestly, which quietly inflates the win rate.