Home › FX Trading School › Beginner
Forex Timeframes Explained: Which One to Start On
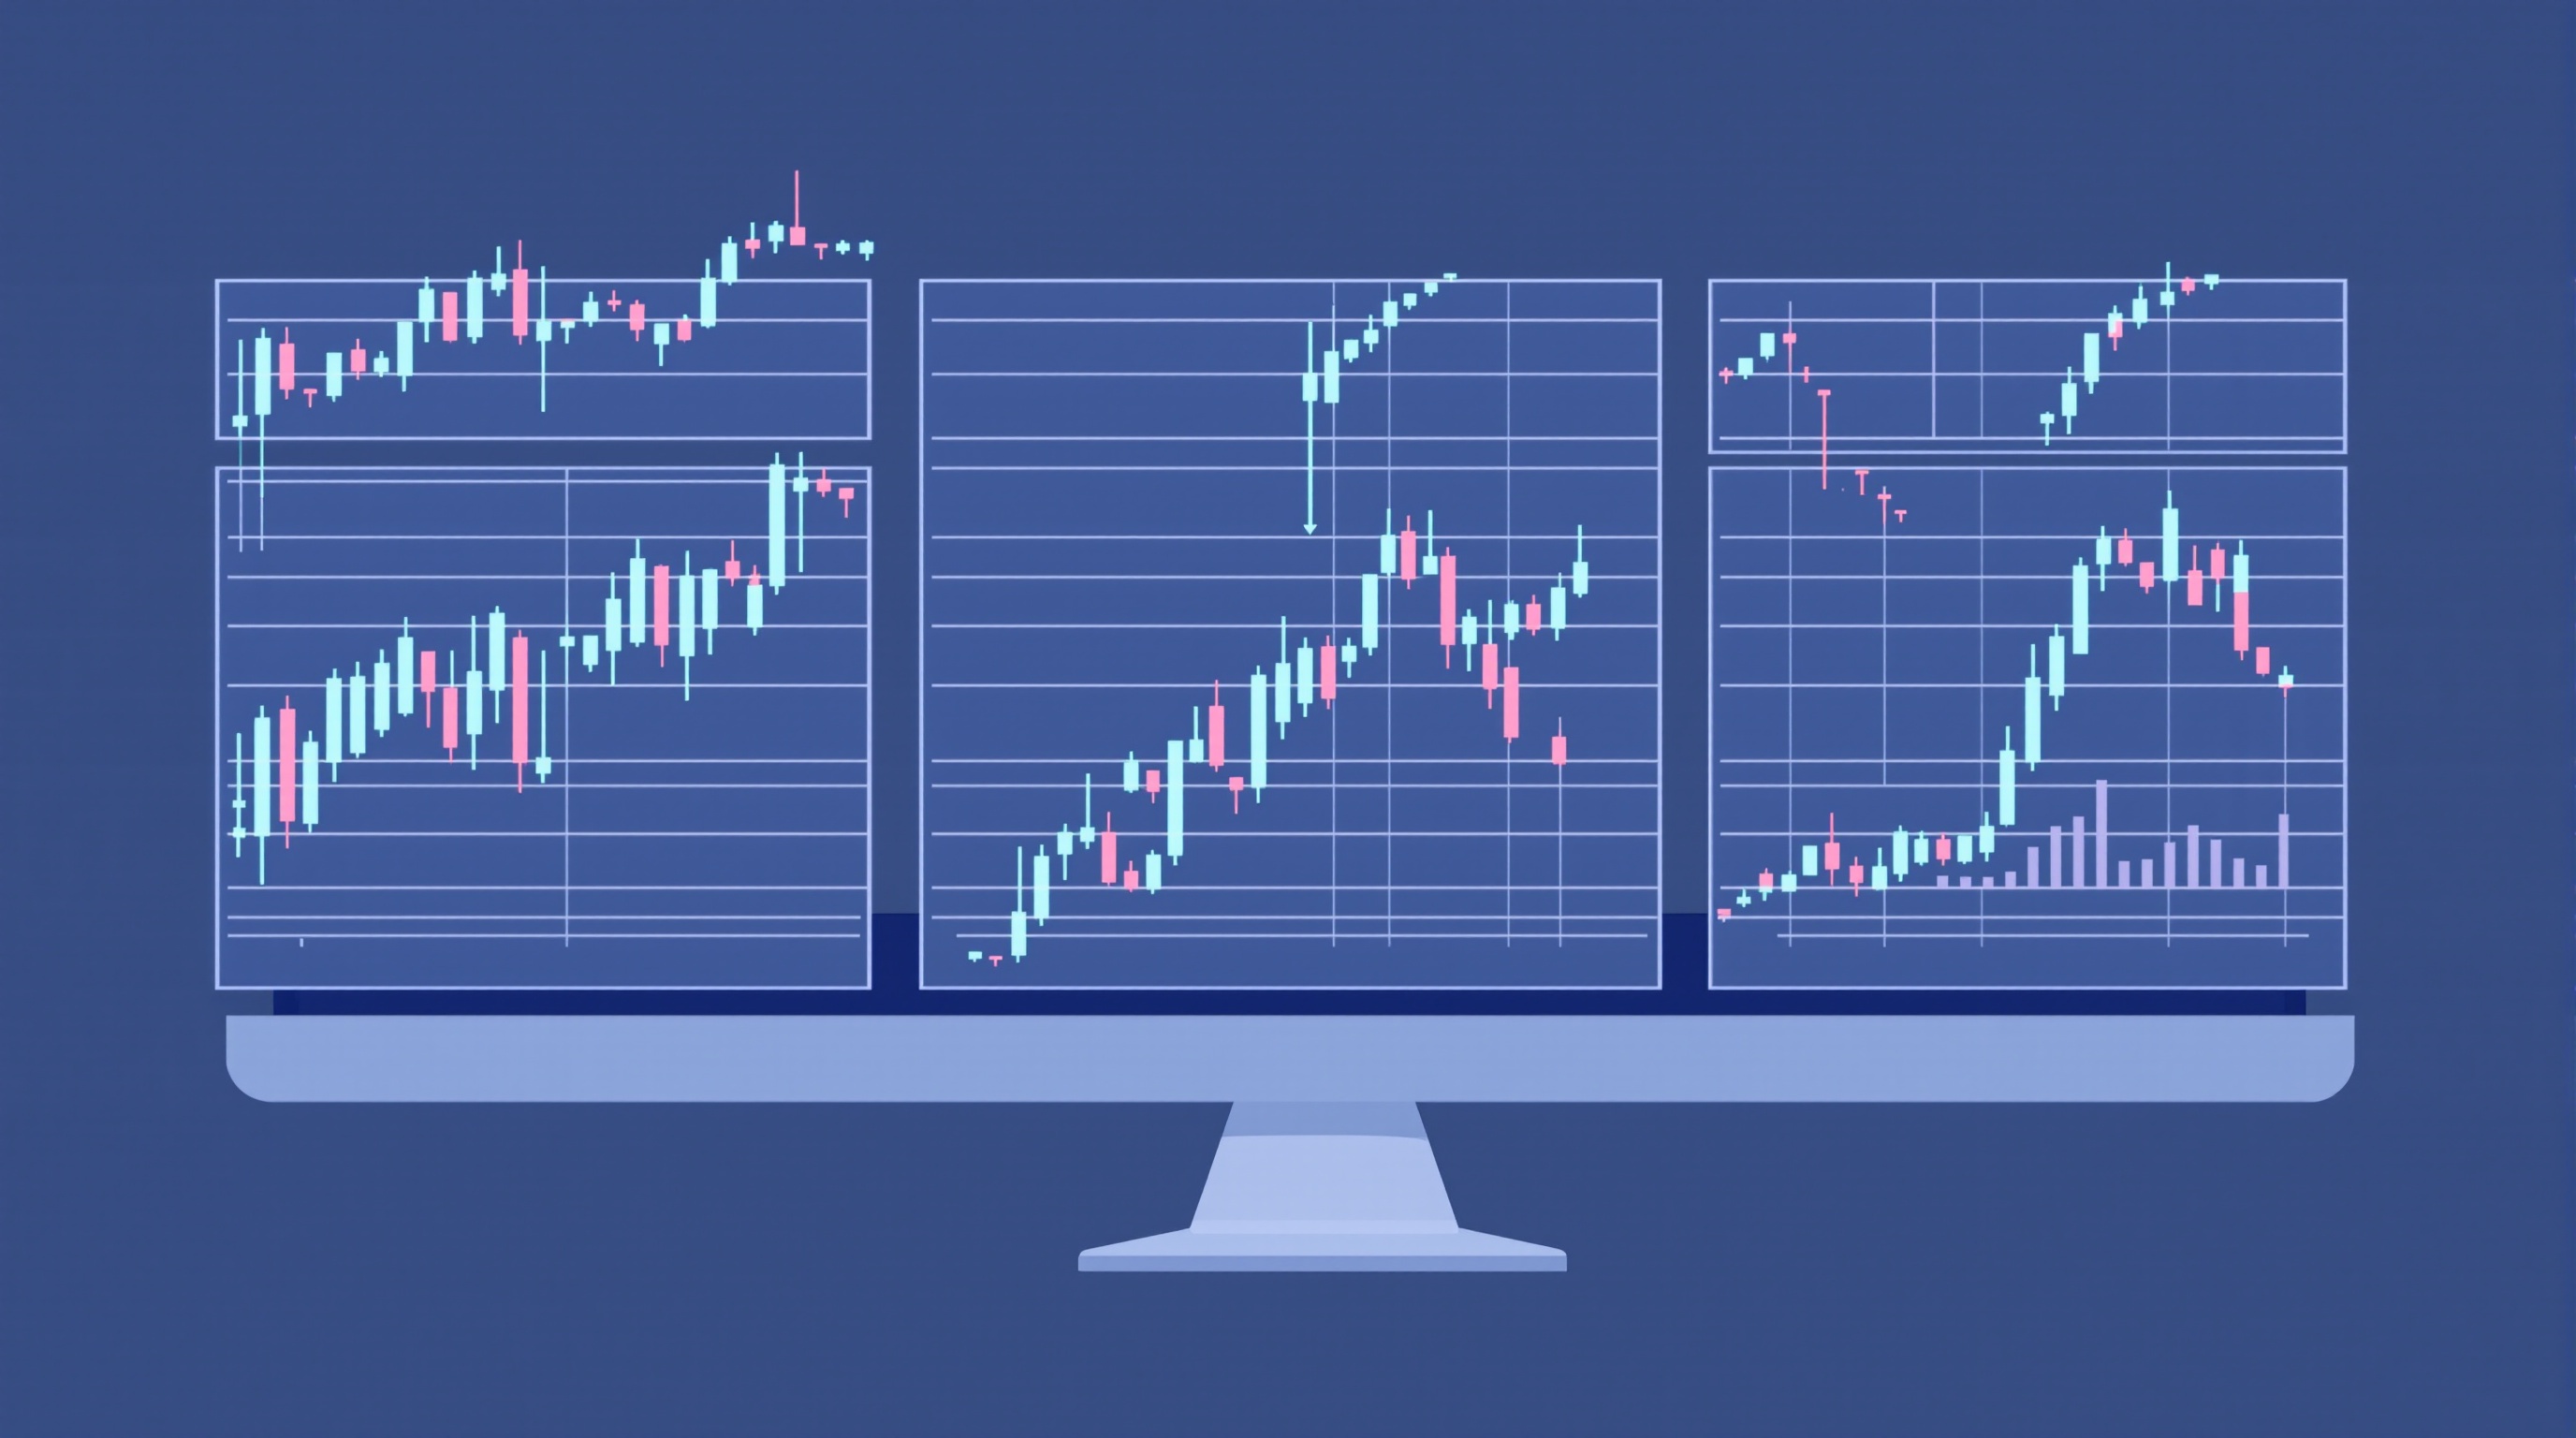
Understanding forex timeframes explained in plain terms is one of the first practical skills every new trader needs, because the timeframe you choose shapes almost everything else — how often you trade, how much noise you see, and how much the spread and commission on each trade actually cost you. This lesson is part of Module 2 · Charts & Orders in the PipTax FX Trading School, and it builds directly on the previous lesson on reading candlestick charts — if you haven't covered what a single candle represents yet, go back and do that first, because timeframes are really just a way of stretching or compressing that same candle logic.
What a timeframe actually is
A timeframe is simply the amount of time each candle (or bar) on your chart represents. Nothing about the underlying market changes — it's the same tick-by-tick price feed from your broker either way. What changes is how those ticks get grouped together.
- M1 (1-minute): each candle shows one minute of price action
- M15 (15-minute): each candle summarises 15 minutes
- H1 (1-hour): each candle covers a full hour
- H4 (4-hour): each candle covers four hours
- Daily (D1): each candle is a full trading day
- Weekly/Monthly: each candle covers a week or a month
Zoom into M1 and you'll see every small wobble in price — a lot of it just noise from short-term buying and selling. Zoom out to Daily and that same noise gets smoothed away, leaving a clearer picture of the broader trend. Neither view is "more correct" — they're both showing the same data, just at different resolutions. The skill is knowing which resolution suits what you're trying to do.
How timeframe choice changes your trading
Picking a timeframe isn't just a chart preference — it has real, practical consequences:
- Trade frequency: lower timeframes generate far more signals and setups, simply because there's more granular data to react to
- Noise vs clarity: shorter timeframes show more false starts and reversals; longer ones filter that out but react slower to genuine changes
- Time commitment: an M5 trader needs to be watching the screen almost constantly; a Daily trader might check once a day
- Stop distances: lower timeframes typically need tighter stops, which are more easily triggered by ordinary volatility
- Cost impact: more trades means paying the spread and any commission more often — a cost that compounds over weeks and months
That last point matters more than most beginners realise. A strategy that looks profitable in theory can be quietly eaten away by transaction costs if it trades too frequently for the account it's running on. Before you settle on a timeframe and style, it's worth running the maths through PipTax's cost tool at /audit.html to see how spread and commission scale with your expected trade count.
Why beginners shouldn't start on the fastest charts
It's tempting to go straight for M1 or M5 charts because they look "exciting" — lots of candles, lots of action. In practice this is one of the harder places for a beginner to start, for a few honest reasons:
- More noise, more false signals — patterns that look convincing on M1 often resolve themselves within minutes, in the opposite direction
- Faster decisions, less time to think — there's little room to pause and check your reasoning before the moment has passed
- Costs bite harder — more trades means paying the spread more often, and on very short timeframes the spread can be a large chunk of the move you're trying to catch
- Emotional strain — watching price flicker every few seconds tends to encourage overtrading and revenge trading after a loss
None of this means fast timeframes are "wrong" — plenty of experienced traders use them well. But they're a harder environment to learn the basics in, precisely because mistakes compound quickly and there's little time to reflect.
Which timeframe to start on
For most people working through this course, H1 or H4 charts are the sensible starting point. Here's why:
| Timeframe | Good for beginners? | Why | |---|---|---| | M1–M5 | No | Too noisy, too fast, high cost impact per pip captured | | M15–M30 | With caution | More manageable, but still busy for a first attempt | | H1 | Yes | Enough detail to learn patterns, slower pace to think | | H4 | Yes | Clear trends, fits around a normal daily routine | | Daily | Yes, for context | Excellent for spotting the bigger picture, fewer trades |
Starting on H1 or H4 gives you enough candles to actually study — support and resistance, trend structure, candlestick patterns — without needing to react in seconds. It also fits realistically around a normal life: you can check an H1 or H4 chart a handful of times a day rather than being glued to the screen.
Multi-timeframe analysis in practice
Once you're comfortable reading a single timeframe, the next natural step is multi-timeframe analysis — looking at more than one chart of the same pair before deciding anything. A simple, beginner-friendly approach:
1. Check the Daily chart first — is the overall trend up, down, or sideways? 2. Move to your main chart (H1 or H4) — does price structure agree with that broader trend? 3. Optionally, use a lower timeframe like M15 purely to fine-tune your entry point, not to change your overall view
This stops you taking a trade that looks fine on H1 but is actually fighting a strong Daily trend — a common beginner mistake. You can test this workflow on the same charting platforms you're already using: Pepperstone's MetaTrader servers and IG's own platform both let you flick between timeframes on the same chart instantly, so there's no excuse not to check.
Timeframes, costs, and choosing where to trade
Whichever timeframe you settle on, it interacts directly with trading costs — and costs vary by broker, account type, and instrument. A scalping-style approach on M5 charts, for example, is far more sensitive to spread than a Daily swing approach, so it's worth checking:
- How your chosen broker's spreads behave at the times of day you plan to trade
- Whether a commission-based account works out cheaper than a spread-only one for your expected trade frequency
- How your costs compare across FCA-regulated brokers like Pepperstone and IG for the pairs you actually trade
Rather than guessing, compare real numbers on the /brokers/index.html pages and run your own trade frequency through /audit.html. See /methodology.html for how PipTax works out these comparisons, so you know exactly what's being measured.
Bringing it together
Getting forex timeframes explained clearly matters far more than most beginners expect, because the timeframe you trade on shapes your trade frequency, your costs, and how much noise you're forced to filter out. Start on H1 or H4, add the Daily chart for context once you're comfortable, and only move to faster timeframes later, once you understand the trade-offs and can afford the extra cost. Trading carries real risk of loss whatever timeframe you choose, so treat this as one building block among many — the next lesson in Module 2 covers order types, which is the natural next step once you know where you're actually looking on the chart.
Key takeaways
- A forex timeframe just changes how much time each candle on your chart represents — the price data itself doesn't change
- Lower timeframes (M1–M15) show more noise and more trades; higher timeframes (H4, Daily) show clearer trends but fewer opportunities
- Most beginners are better off starting on H1 or H4 charts — enough detail to learn, not so much noise you get whipsawed
- Multi-timeframe analysis means checking a higher timeframe for the trend before you look at a lower one for entries
- Your chosen timeframe should match the time you can realistically spend watching charts, not the other way round
- Spreads and commissions bite harder the more often you trade, so timeframe choice has a direct cost impact — check it with PipTax's cost tool
Frequently asked questions
- What is the best timeframe for beginners in forex?
- There's no single 'best' timeframe, but most beginners find the H1 (1-hour) or H4 (4-hour) chart easiest to learn on. They show enough price detail to spot patterns without the constant noise of M1 or M5 charts, and they don't demand you watch the screen all day.
- Can I trade forex using just one timeframe?
- You can, but most experienced traders use at least two: a higher timeframe to judge the overall trend and a lower one to time entries. Relying on a single timeframe means you're often missing context that's visible on the chart one level up.
- Do lower timeframes mean more trading costs?
- Generally yes. Trading M1 or M5 charts usually means more trades, and every trade pays the spread and any commission. Over weeks and months that adds up. Run your own numbers through PipTax's cost tool at /audit.html before committing to a fast timeframe.
- Does the timeframe change the actual price data?
- No. The underlying tick data from your broker's feed is identical whatever timeframe you view. Changing timeframe only changes how those ticks are grouped into candles — it's a different lens on the same market, not different information.
- How many timeframes should I look at before placing a trade?
- Two or three is plenty for a beginner: one higher timeframe for context (e.g. Daily or H4), one for your main analysis (e.g. H1), and sometimes one lower for entry timing (e.g. M15). More than that usually adds confusion rather than clarity.