Home › FX Trading School › Intermediate
Fibonacci Retracement in Practice: A Trader's Guide
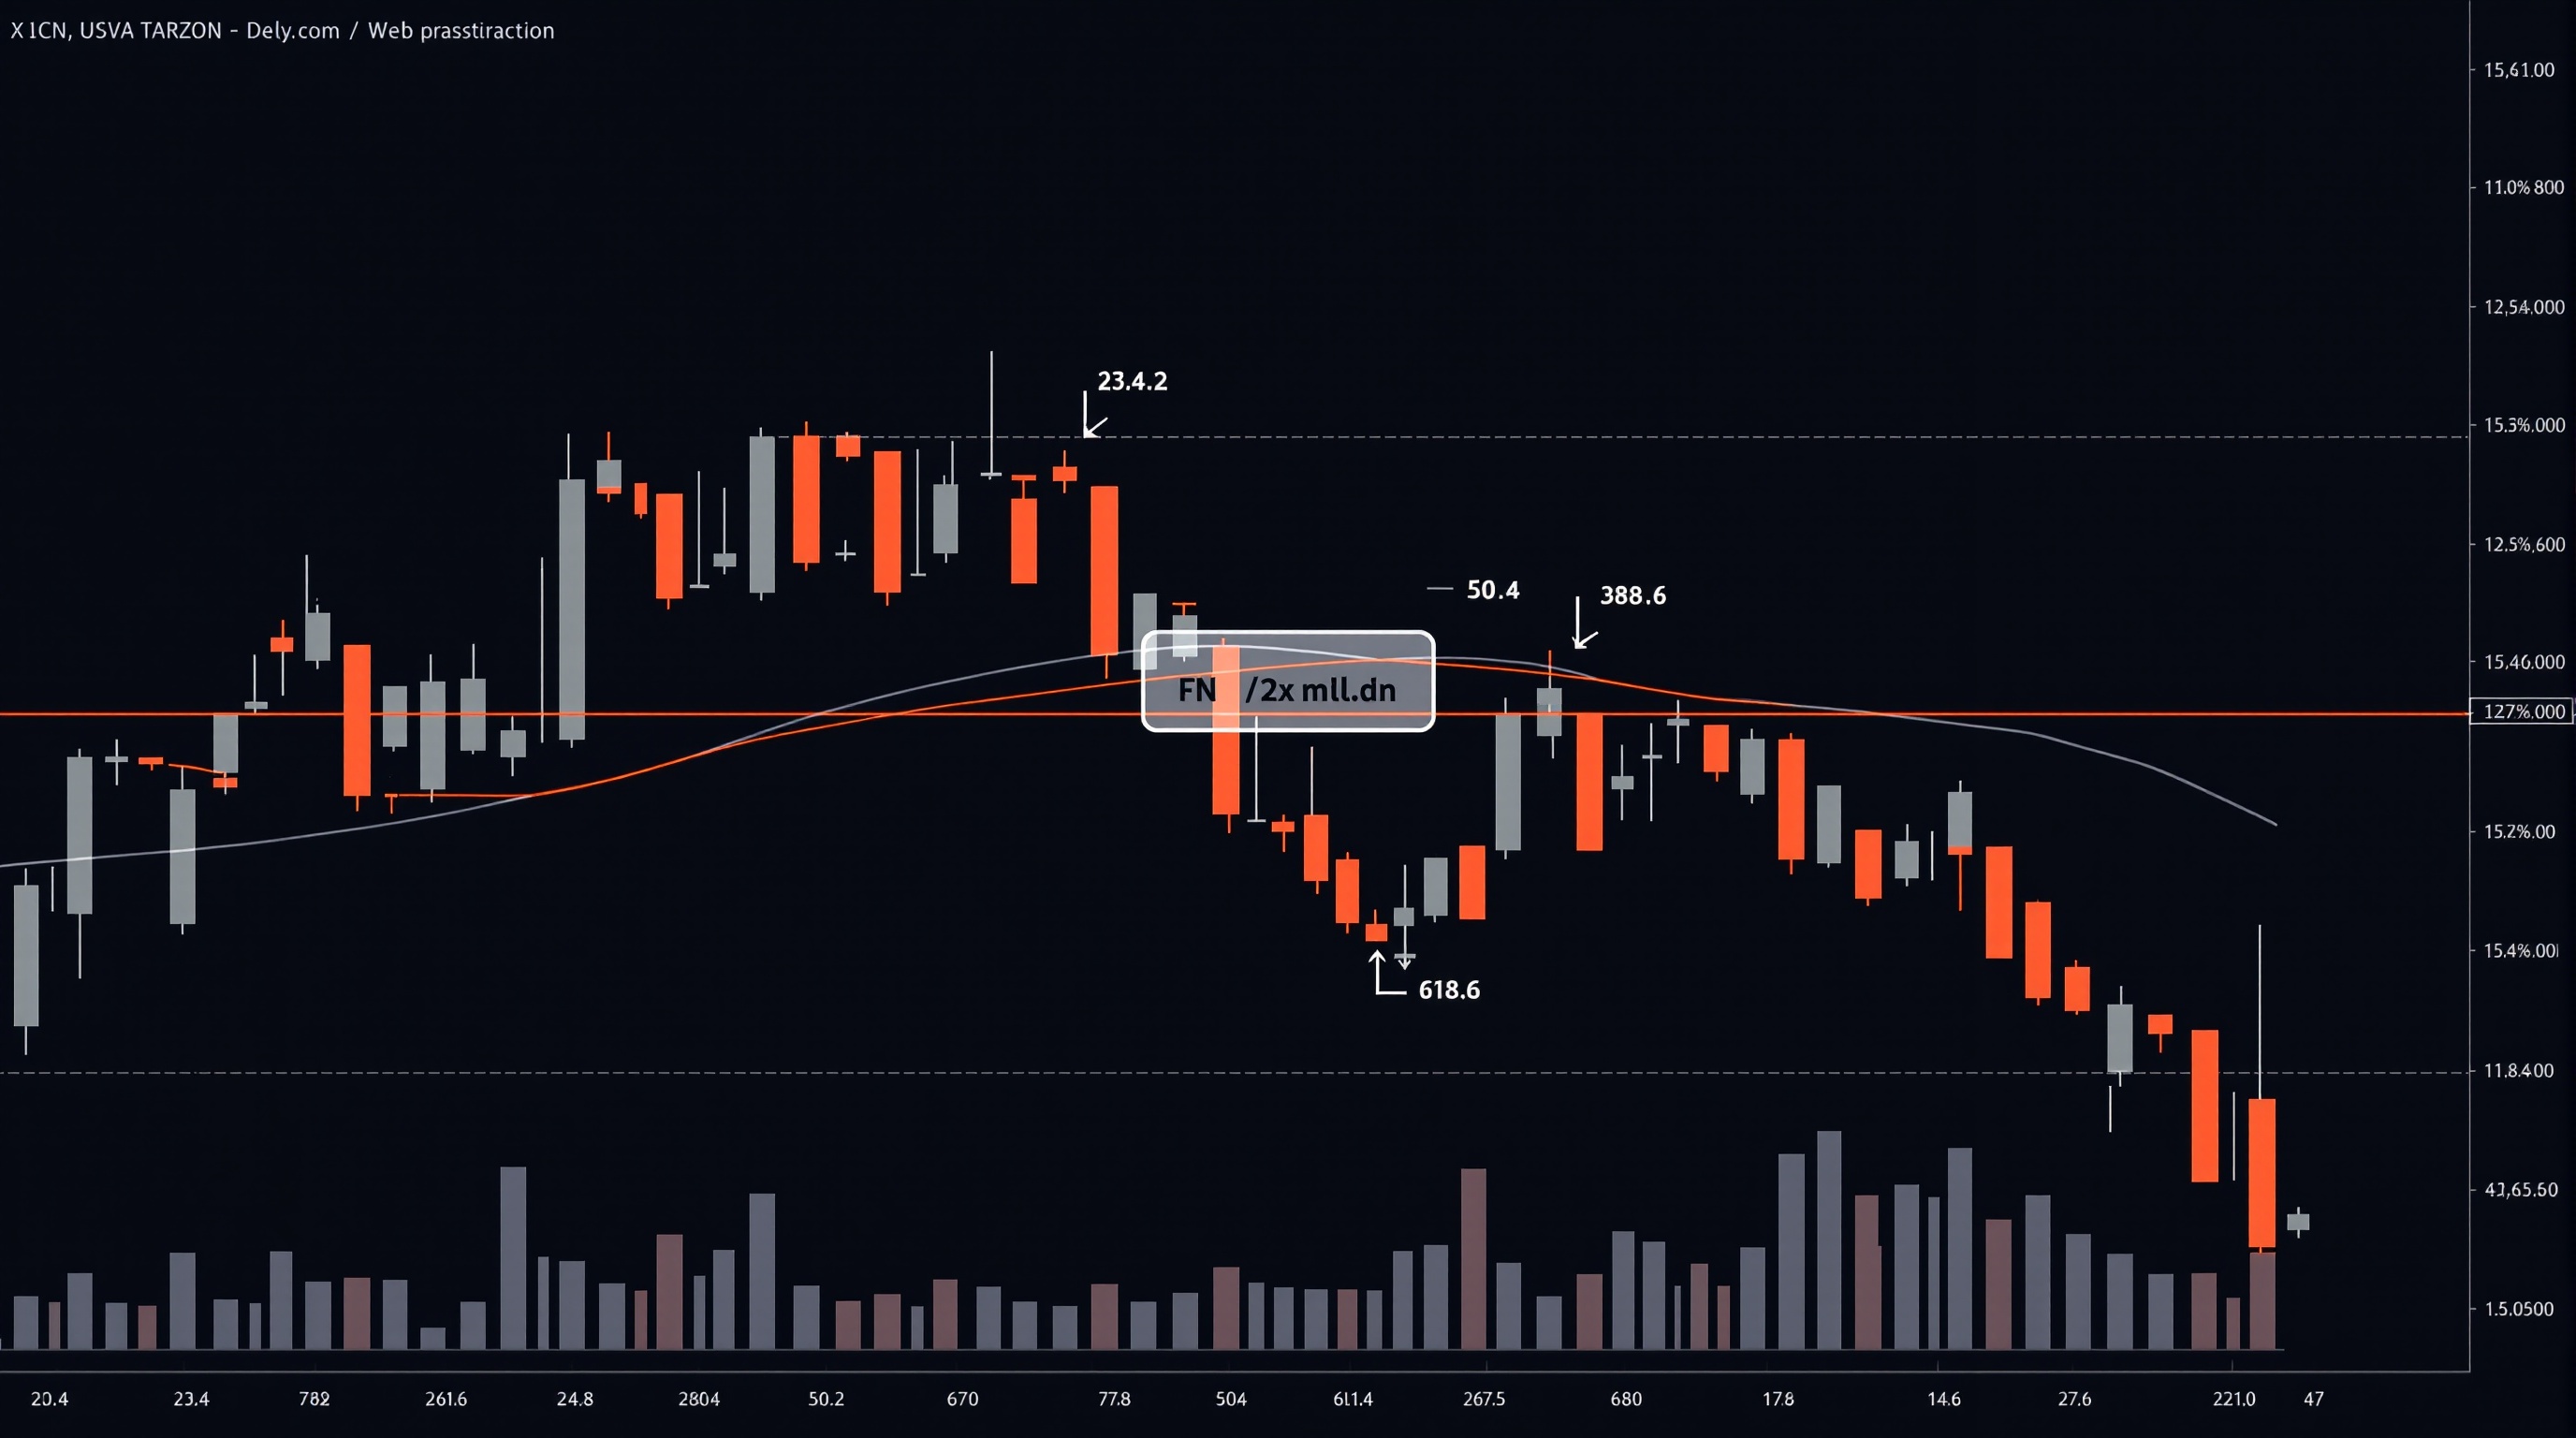
Fibonacci retracement is one of the most widely used tools in technical analysis, and also one of the most misunderstood. Used properly, it gives you a structured way to guess where a pullback within a trend might pause or reverse. Used badly, it becomes a way to draw lines until the chart agrees with whatever trade you already wanted to take. This lesson, part of Module 6 on technical analysis, builds on the support and resistance and trend structure concepts covered earlier in the course, and shows you a practical, honest workflow for using Fibonacci retracement in real trading decisions.
What Fibonacci Retracement Actually Measures
Fibonacci retracement levels come from a mathematical sequence where each number is the sum of the two before it (0, 1, 1, 2, 3, 5, 8, 13…). The ratios between numbers in this sequence — roughly 23.6%, 38.2%, 50%, 61.8% and 78.6% — show up so often in nature and markets that traders started applying them to price charts.
In practice, the tool measures how far price has "retraced" (pulled back) from a recent swing move, as a percentage of that move. If EUR/USD rallies from 1.0500 to 1.0700, a 50% retracement would bring price back to 1.0600 — halfway between the two.
A few honest points worth stating upfront:
- It's not magic. There's no proven law forcing price to respect these levels — it works because enough traders watch the same levels and act on them.
- It measures pullbacks, not reversals. Fibonacci retracement assumes the existing trend continues after the pullback; it's a different tool from Fibonacci extension, which projects targets beyond the original move.
- 50% isn't technically a Fibonacci ratio — it's included because markets so often retrace roughly half a move, and most platforms show it by default alongside the true Fibonacci ratios.
Drawing It Correctly
Getting the tool onto your chart correctly matters more than most beginners realise. Get the swing wrong and every level that follows is meaningless.
Step-by-step:
1. Identify a clear, recent swing high and swing low on your chosen timeframe. 2. In an uptrend, click the Fibonacci tool on the swing low and drag to the swing high — this measures a pullback down. 3. In a downtrend, click on the swing high and drag to the swing low — this measures a pullback up. 4. Let the platform plot the standard levels (23.6%, 38.2%, 50%, 61.8%, 78.6%) automatically. 5. Check the levels visually against recent price action before treating any of them as significant.
Both Pepperstone (via its MetaTrader servers) and IG (on its own platform) include a standard Fibonacci retracement drawing tool, so you don't need third-party software to get started — just practise on a demo chart until the swing selection becomes second nature.
Which Levels Actually Matter
Not all five levels deserve equal attention. Here's how most experienced traders weight them:
| Level | Typical interpretation | |---|---| | 23.6% | Shallow pullback — often just noise in a strong trend | | 38.2% | Common in strong trends; a fairly aggressive continuation entry | | 50.0% | Psychologically important, widely watched even though not a true Fibonacci ratio | | 61.8% | The "golden ratio" — many traders treat this as the last reasonable point before a trend is considered broken | | 78.6% | Deep retracement; some treat a break below this as a trend failure |
A sensible approach for an intermediate trader is to focus on the 38.2%–61.8% zone as your primary area of interest, and treat anything beyond 78.6% as a signal the original trend may be losing conviction rather than pulling back.
Combining Fibonacci With Other Tools
Fibonacci retracement on its own gives you a level — nothing more. Its real value comes from confluence: when a Fibonacci level lines up with something else you already trust.
Things worth checking alongside a Fibonacci level:
- Prior support/resistance — did price previously turn at roughly the same price?
- Trendlines — does a valid trendline cross through the same zone?
- Round numbers — psychological levels like 1.1000 often coincide with Fibonacci zones.
- Candlestick patterns — a pin bar or engulfing pattern forming right at a Fibonacci level adds weight.
- Moving averages — a 50 or 200-period moving average sitting near the same price adds another layer.
The more of these line up in the same small price zone, the more traders are likely watching it — which is really the entire basis for why Fibonacci retracement works at all.
A Practical Fibonacci Retracement Trading Strategy
Here's a simple, honest framework to test — not a guaranteed system:
1. Identify the trend on your working timeframe using higher highs/higher lows (or the reverse for a downtrend). 2. Draw the retracement from the most recent significant swing. 3. Wait for price to enter the 38.2–61.8% zone. 4. Look for confirmation — a candlestick reversal signal, or a bounce off a moving average or prior support level within that zone. 5. Set a stop just beyond the 78.6% level or the swing extreme, so a false break doesn't wipe out the trade. 6. Target the prior swing high/low, or use a Fibonacci extension for a further objective.
Backtest this on historical charts across several pairs before trading it live, and keep records of how often the zone actually held versus how often price ran straight through.
Common Mistakes With Fibonacci Retracement
- Forcing the swing. Picking a swing high/low that "makes" the level line up with where you want to trade is the single most common error.
- Treating levels as exact prices. Price rarely stops on the pip; think in zones, not lines.
- Ignoring the broader trend. A Fibonacci bounce against a strong dominant trend on a higher timeframe is a lower-probability trade.
- Overloading the chart. Drawing Fibonacci from every swing on every timeframe just produces noise.
- Forgetting costs. Every entry and stop-out has a real cost in spread or commission — check /cost-impact.html to see how that affects a strategy that trades frequently around retracement zones.
Conclusion
Fibonacci retracement is a genuinely useful way to structure where a pullback might end, but it only earns its place in your toolkit when combined with other confirmation — trend direction, support/resistance, and price action. Practise drawing it correctly on demo charts with Pepperstone's or IG's platforms, keep a record of how price behaves at each level, and always confirm your real trading costs on /audit.html before committing capital, because no chart pattern overcomes a poor cost structure. Remember: trading carries genuine risk, and most retail accounts lose money — treat Fibonacci retracement as one input in a disciplined process, never a shortcut.
Key takeaways
- Fibonacci retracement measures how far price might pull back within an existing trend, using ratios derived from the Fibonacci sequence — it is not a standalone signal
- The 38.2%, 50% and 61.8% levels are the ones most traders watch; treat them as zones of interest, not exact turning points
- Always draw from a clear swing low to swing high (or vice versa) on a timeframe that matches your trading style
- Fibonacci works best as confluence with support/resistance, trendlines or candlestick patterns covered earlier in this module — never in isolation
- Because levels are only 'areas of interest', backtest any Fibonacci-based entry rule before risking live capital
- Trading carries real risk of loss; use the cost tool and broker pages to understand how spreads and commissions affect a Fibonacci strategy over time
Frequently asked questions
- What is the most reliable Fibonacci retracement level?
- None of them are reliable on their own. The 50% and 61.8% levels get the most attention because a lot of traders watch them, which can become a bit self-fulfilling, but plenty of pullbacks blow straight through every level. Treat all of them as zones to watch, not guaranteed turning points.
- Should I use Fibonacci retracement on every timeframe?
- You can draw it on any timeframe, but it's more useful on the timeframe you actually trade. A day trader drawing Fibonacci on a weekly chart and expecting a reaction on a 15-minute entry is mixing signals. Match the swing you measure to your holding period.
- Does Fibonacci retracement work better with certain currency pairs?
- It's a chart-pattern tool, not a pair-specific one, so it applies equally to majors like EUR/USD or GBP/USD and to less liquid pairs. What changes is cost — wider spreads on exotic pairs eat into any strategy, so check /cost-impact.html before trading a Fibonacci setup on a thinly traded instrument.
- Can I automate Fibonacci retracement in an EA?
- Yes, most platforms including MetaTrader let you code swing detection and Fibonacci levels into an Expert Advisor, but defining a 'valid swing' programmatically is harder than it looks and needs careful backtesting before going live.
- Do Pepperstone and IG offer a built-in Fibonacci tool?
- Both give you access to charting packages with a Fibonacci retracement drawing tool as standard — Pepperstone through its MetaTrader servers and IG through its own platform. Neither broker's spreads or commissions change based on which drawing tools you use, so pick the platform on functionality, not pricing assumptions, and confirm live costs on /brokers/index.html.