Home › FX Trading School › Intermediate
Drawing Trend Lines and Channels That Actually Work
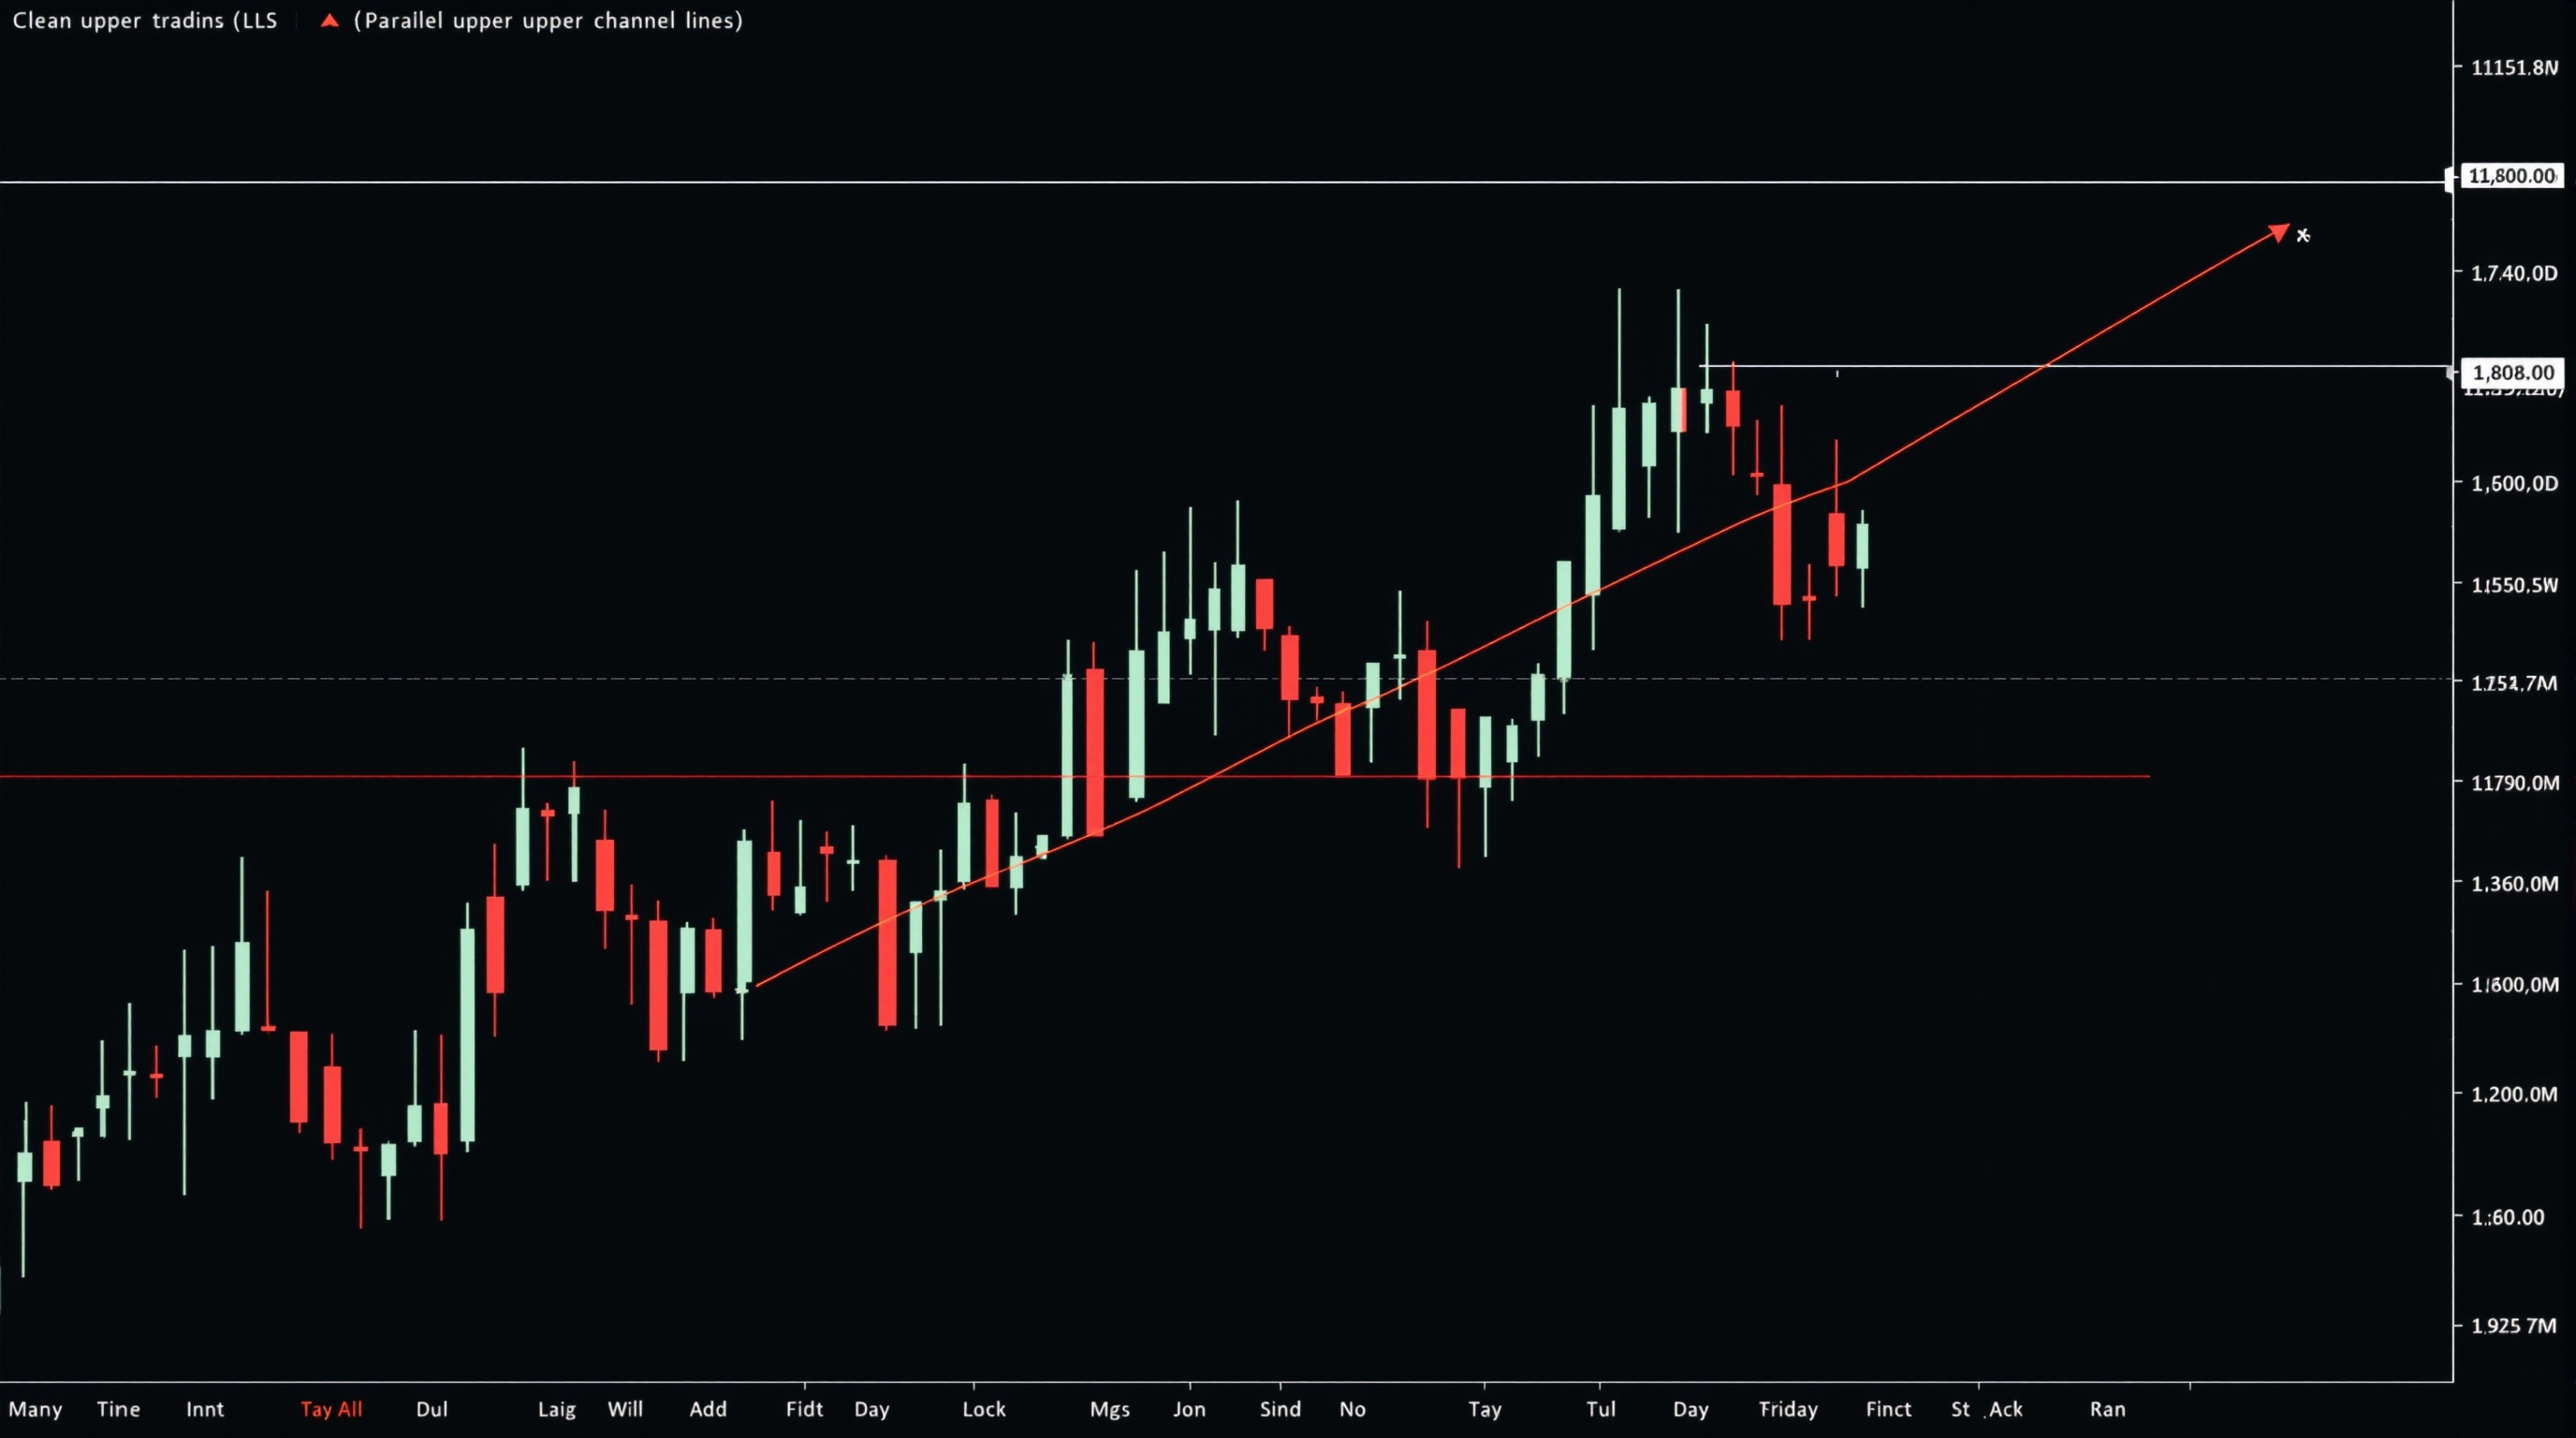
Drawing trend lines and channels is one of the first "real" technical analysis skills every trader learns, but most people do it badly — connecting random wicks and calling it a trend. This lesson, part of Module 6: Technical Analysis in the PipTax FX Trading School, builds on the swing highs and swings lows you learned to identify in the previous module, and turns that into a repeatable method for drawing lines you can actually trade from.
Why Most Trend Lines Fail
The most common mistake is forcing a line to fit a bias you already have, rather than letting the price structure define the line. A trend line only means something if it's built from genuine swing points — the same swing highs and lows used in market structure analysis.
Bad trend lines usually share these traits:
- Drawn through candle bodies rather than the wicks or a consistent reference point
- Anchored to only two points, with no third touch to confirm it
- Too steep — a line connecting a sharp, unsustainable rally will break almost immediately
- Redrawn constantly to keep matching price, instead of being left alone once set
A trend line is a hypothesis: "price is respecting this slope." Like any hypothesis, it needs testing, not fitting after the fact. If you find yourself erasing and redrawing a line every few candles, that's a sign the original trend line wasn't valid — not a reason to keep adjusting it.
The Three-Point Rule
Two points make a line. Three points make a trend line worth trusting.
Here's the workflow:
1. Identify at least two swing lows (in an uptrend) or swing highs (in a downtrend). 2. Draw a straight line connecting them. 3. Wait for price to return to that line a third time and react — bounce, stall, or reverse.
Only once you have that third touch should you treat the line as a live, tradeable level. Before that, it's just a possibility. This is slower than eyeballing a line off two points, but it filters out a huge amount of noise, and it's the same discipline experienced chartists apply on both MetaTrader and platforms like IG's own charting package.
Practical note: on lower timeframes (M15, M5), you'll get more "trend lines" that qualify but far more that fail. On H4 and Daily, valid three-point trend lines are rarer but far more reliable — a trade-off worth knowing before you start drawing on a 1-minute chart.
Building a Channel From Your Trend Line
A channel is simply your trend line plus a parallel line on the opposite side of price action, creating a corridor.
To draw one:
1. Draw your validated trend line along the swing lows (uptrend) or swing highs (downtrend). 2. Find the swing point that pokes furthest away from that line on the opposite side. 3. Draw a second line through that point, parallel to the first.
You now have a channel with:
- A lower rail (support in an uptrend)
- An upper rail (resistance in an uptrend)
Channels help you visualise where price tends to oscillate between the two extremes, and where it's statistically stretched. Price touching the upper rail in a strong uptrend doesn't mean "sell" — it means "this is the edge of the recent range, be alert."
| Line type | Built from | Typical use | |---|---|---| | Trend line | Swing lows or highs | Direction and dynamic support/resistance | | Channel (parallel) | Opposite extreme swing | Range edges, potential exhaustion zones |
Angle, Steepness and What They Tell You
The angle of a trend line is data, not decoration.
- Shallow, gradual lines tend to reflect sustainable trends with healthy pullbacks.
- Steep, near-vertical lines often mark blow-off moves, news spikes, or short squeezes — these break more often than they hold.
- Flattening trend lines over time can signal a trend losing momentum, even before price actually breaks the line.
When a trend line's angle changes noticeably (you have to redraw it steeper or shallower to keep fitting new swings), that's often more informative than the break itself. It's an early warning that the character of the move is shifting.
Trading Trend Line and Channel Breaks
A break of a trend line or channel rail is not automatically a signal — it's a prompt to look closer. Before acting:
- Wait for a candle close beyond the line, not just a wick poke.
- Check volume or momentum (where available) for confirmation the break has conviction.
- Watch for a retest — price often returns to the broken line before continuing, offering a cleaner entry than chasing the initial break.
- Consider the higher timeframe trend — a break on M15 against the H4 trend is a weaker signal than one aligned with it.
This is where trend line analysis connects to risk management: even a textbook-perfect break can fail. Always define your invalidation point (stop loss) before entering, based on where the setup would prove wrong, not on an arbitrary pip count.
Practising Across Brokers and Platforms
The mechanics of drawing trend lines and channels are identical wherever you trade, but it's worth practising on the actual platform and price feed you'll use live, since candle shapes can differ slightly between brokers due to feed timing:
- On Pepperstone's MetaTrader servers, use the trend line and parallel channel tools in the drawing toolbar — lines can be locked and colour-coded per instrument.
- On IG's own platform, the equivalent drawing tools sit in the chart toolbar with similar snap-to-price behaviour.
Neither platform's charting quality has anything to do with trading cost — that's a separate question. Once you've got a valid trend line or channel guiding a trade idea, run the setup through PipTax's [cost tool](/audit.html) to see how spread and commission at your broker affect the real breakeven point, and check [/brokers/index.html](/brokers/index.html) for how execution costs compare before you commit size to the trade.
Conclusion
Drawing trend lines and channels well is less about artistic chart-drawing and more about discipline: wait for genuine swing points, insist on a third touch before trusting a line, and treat breaks as prompts to investigate rather than automatic signals. Combine this with sound risk management and honest cost awareness, and trend lines become a genuinely useful part of your technical analysis toolkit — not just decoration on a chart.
Key takeaways
- A trend line needs at least three touching swing points before it should be trusted, not just two.
- Channels are built by adding a parallel line through the furthest opposite swing point from your trend line.
- Steep, sharp trend lines tend to break sooner than shallow, gradual ones.
- A break of a trend line or channel rail is a prompt to investigate, not an automatic trade signal — wait for a candle close and consider a retest.
- Practise drawing lines on the actual platform you trade with, such as Pepperstone's MetaTrader or IG's own platform, since candle shapes can vary slightly by feed.
- Trend line analysis should always be paired with defined risk and a check of real trading costs via the cost tool.
Frequently asked questions
- How many touches does a trend line need to be valid?
- Two points define a line, but most experienced traders wait for a third touch where price reacts to the line before treating it as a genuine, tradeable trend line.
- What's the difference between a trend line and a channel?
- A trend line is a single line connecting swing highs or lows. A channel adds a second, parallel line through the opposite extreme swing point, creating a corridor that shows both the direction and the likely range of price.
- Should I draw trend lines through candle wicks or bodies?
- Pick one convention and stay consistent — most traders use wicks to capture the full extreme of price, then double-check by seeing if the line also aligns reasonably with candle bodies. Consistency matters more than which one you choose.
- Does a break of a trend line always mean the trend has reversed?
- No. A break simply means price has moved beyond the line — it doesn't confirm reversal. Traders typically wait for a confirmed candle close beyond the line and often look for a retest before treating it as a genuine trend change.
- Do trend lines work the same way on every broker's charts?
- The drawing tools and logic are the same, but candle shapes can differ slightly between brokers due to feed timing and tick data. It's worth practising on the actual platform you trade live, such as Pepperstone's MetaTrader servers or IG's own platform.
- Can trend line analysis tell me anything about trading costs?
- No — trend lines are purely a price-structure tool. For real spread, commission and swap figures at your broker, use PipTax's cost tool rather than relying on chart patterns.