Home › FX Trading School › Advanced
Detecting and Avoiding Overfitting in FX Strategies
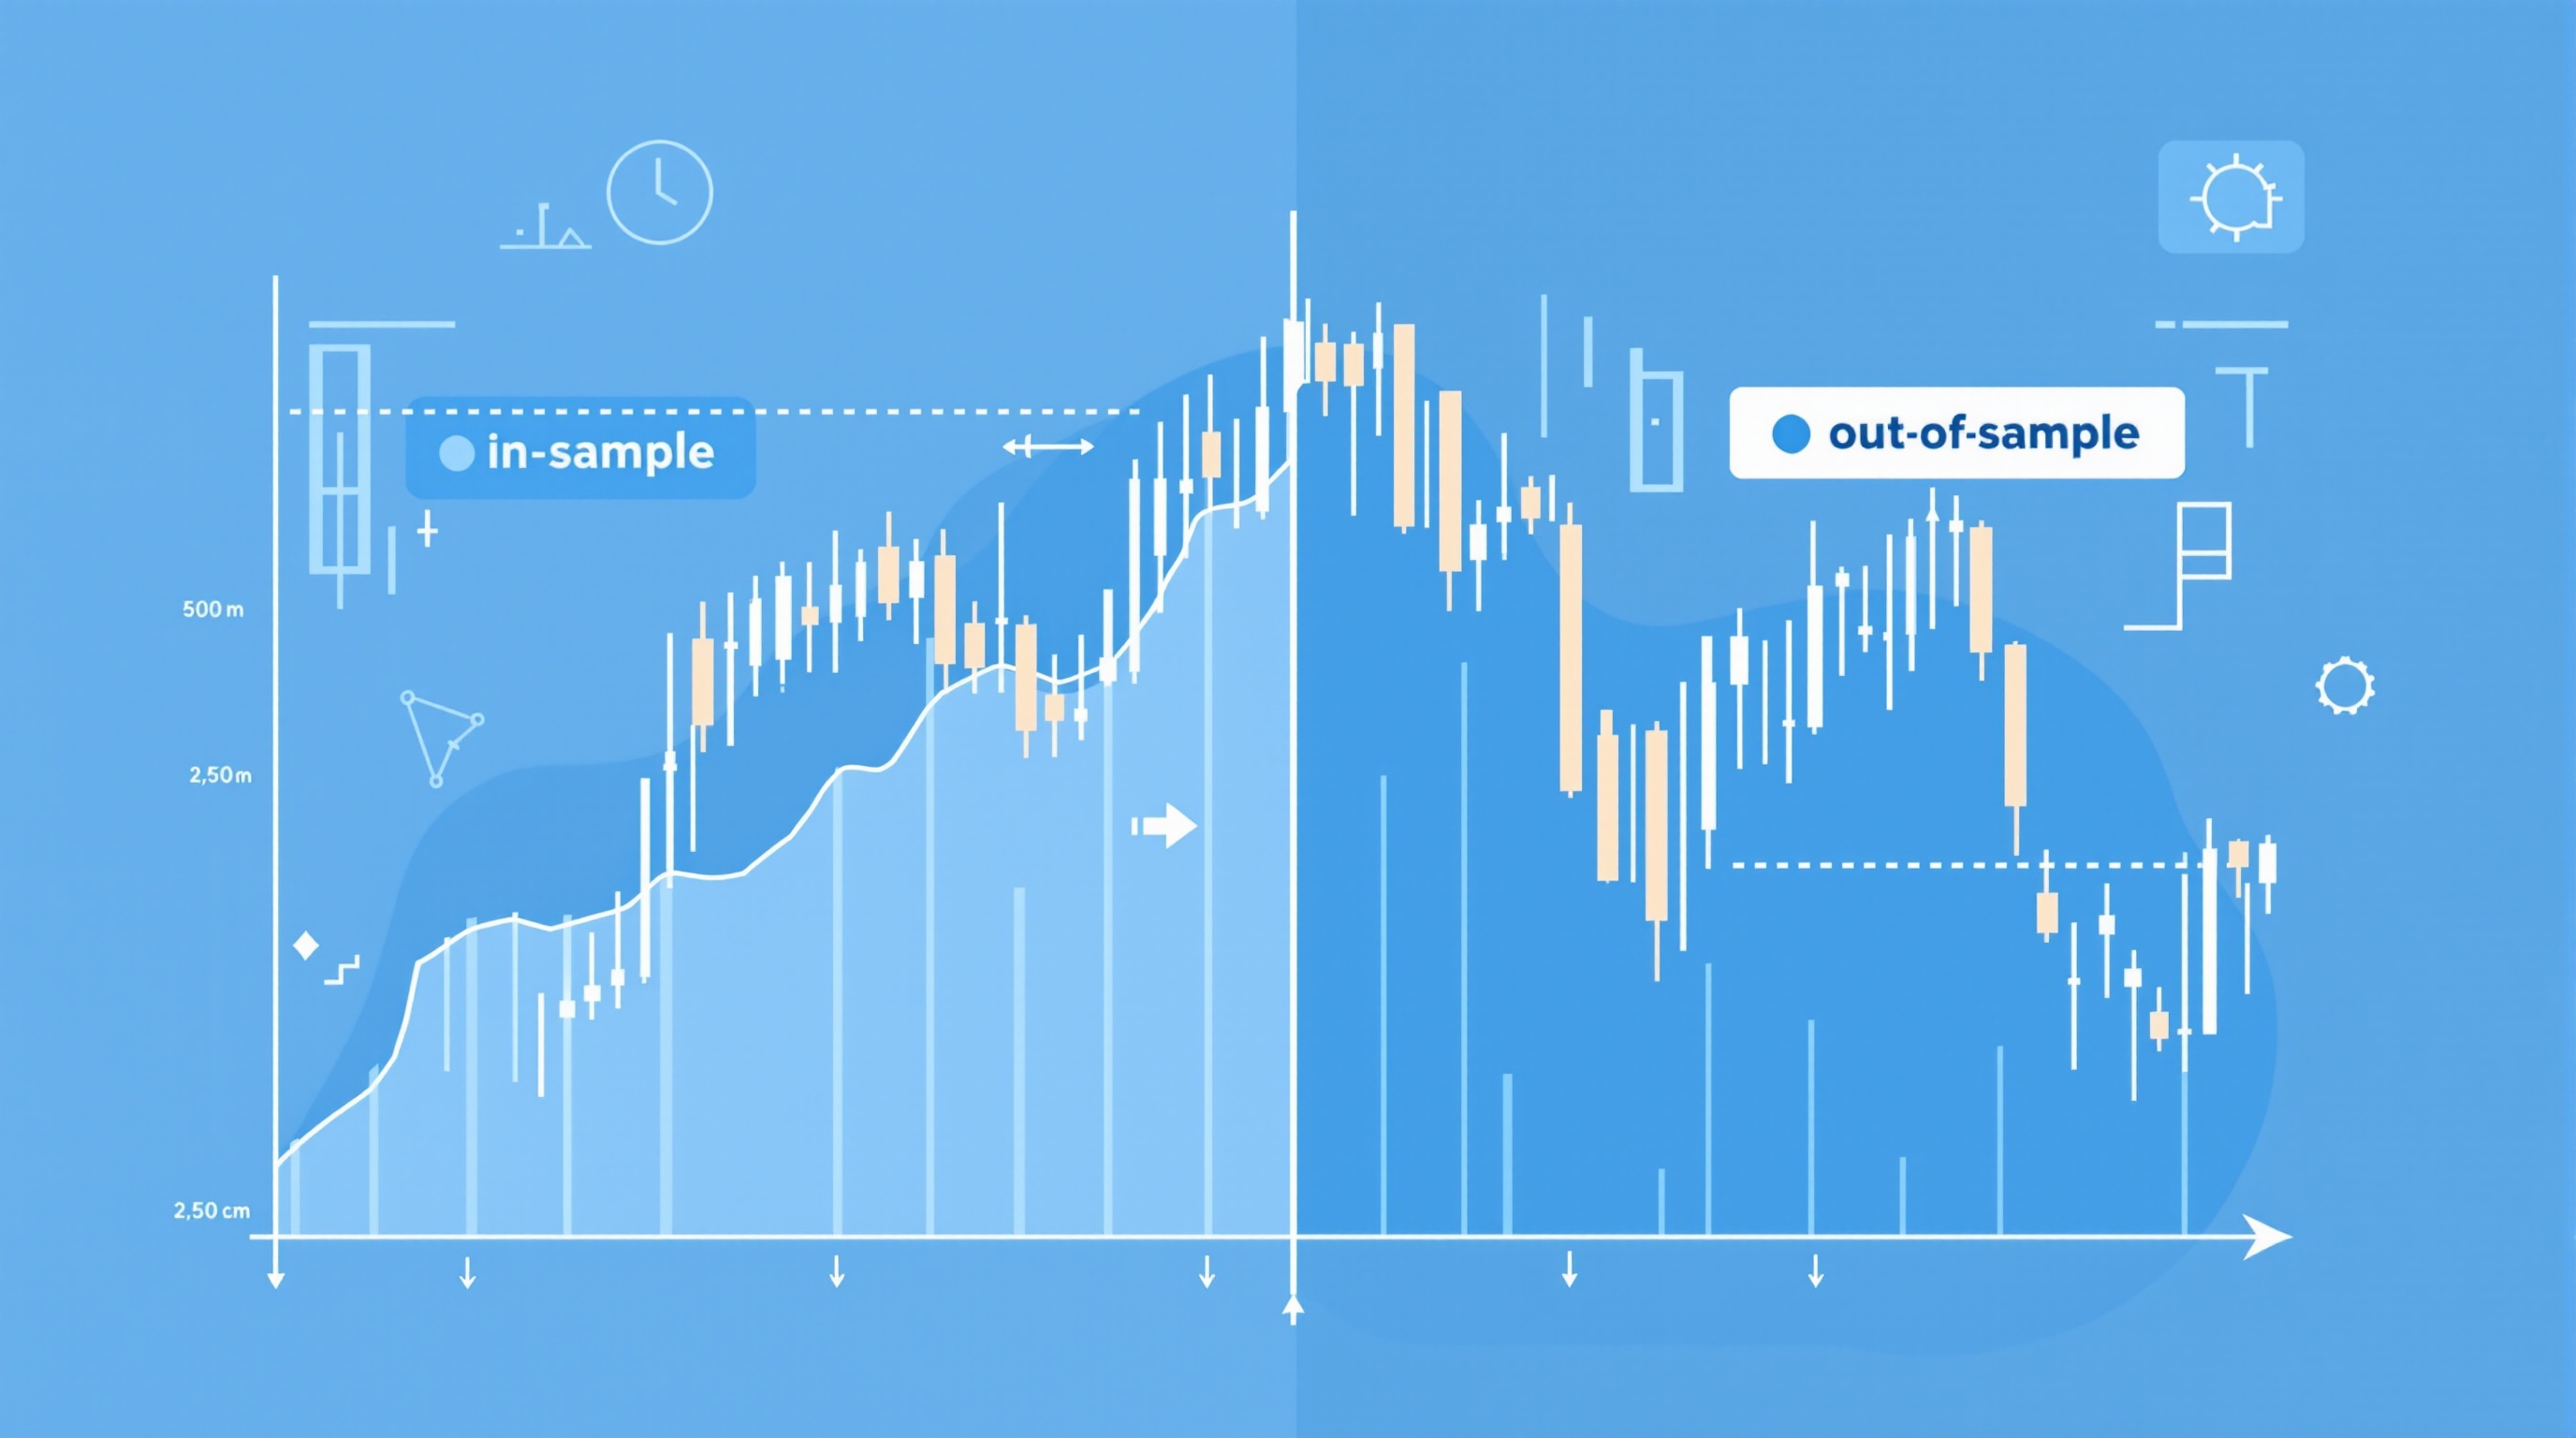
Detecting overfitting is one of the most important skills separating traders who survive the transition from backtest to live account from those who blow up within weeks. This lesson builds on Module 12 (Backtesting Fundamentals) and Module 15 (Statistical Significance in Strategy Testing) — if those concepts are hazy, revisit them before continuing, because everything here assumes you already know how to build and read a basic backtest.
By this point in the course you should be comfortable running a backtest and reading a performance report. This module is about learning to distrust a backtest that looks too good, and having a concrete process to find out why.
What Overfitting Actually Is
Overfitting means your strategy's rules have been shaped around the specific historical data you tested on, rather than around a genuine, repeatable market behaviour. It's the trading equivalent of memorising the answers to last year's exam paper instead of learning the subject.
This typically happens when you:
- Add parameters until the backtest looks perfect — an extra filter here, a tweaked stop-loss there
- Optimise on the same data you validate on — no held-out sample to check against
- Cherry-pick the date range — starting the test conveniently after a losing streak
- React to individual trades rather than patterns — adding a rule to avoid one specific bad trade
The result is a strategy that fits the past almost perfectly but has no real predictive power. It hasn't found an edge; it's found noise and mistaken it for one. This distinction matters enormously because an overfit strategy will pass every check you throw at it — until you trade it with real money on data it's never seen.
The Warning Signs to Look For
Before running any formal validation, an experienced trader learns to eyeball a backtest with suspicion. Common red flags include:
- A suspiciously smooth equity curve — real edges have drawdowns and rough patches; a near-straight line up is a warning, not a compliment
- High parameter count — more than three or four adjustable inputs (MA lengths, thresholds, multipliers) gives the optimiser huge freedom to fit noise
- Performance that's fragile to small changes — shift your entry filter by one pip or your lookback by one bar, and results collapse
- Results that only work on one instrument or one timeframe — a genuine edge usually shows some consistency across related pairs
- Unrealistic win rates — anything north of 70-80% on a mechanical FX system deserves serious scrutiny
None of these alone proves overfitting, but two or three together should stop you before you fund an account.
Walk-Forward Analysis: The Core Defence
Walk-forward analysis is the single most useful technique for detecting overfitting, and every advanced trader should have it in their toolkit.
The process:
1. Split your historical data into sequential windows — say, 12 months of "in-sample" data followed by 3 months of "out-of-sample" data 2. Optimise your parameters only on the in-sample window 3. Test those fixed parameters, unchanged, on the following out-of-sample window 4. Record the result, then roll the whole window forward and repeat 5. Stitch together all the out-of-sample segments — this combined curve is your honest estimate of live performance
If the out-of-sample results are meaningfully worse than the in-sample results across most windows, you've likely built a curve-fit system. A genuinely robust strategy will show some performance decay from in-sample to out-of-sample — that's normal — but it shouldn't fall apart.
Out-of-Sample Testing and Data Splits
Even without full walk-forward automation, a basic in-sample/out-of-sample split is non-negotiable. A common approach:
| Split | Typical use | Purpose | |---|---|---| | 60-70% of data | In-sample | Build and tune the strategy | | 15-20% of data | Out-of-sample (validation) | Check it still works on unseen data | | 15-20% of data | Final holdout | One-time final check before going live |
The final holdout is sacred — look at it once, right before you decide whether to trade the strategy live, and never touch it again for tuning. The moment you re-optimise based on the holdout result, it stops being a holdout.
Costs Are Part of Validation, Not an Afterthought
A strategy that only survives on a zero-cost backtest is already overfit to an imaginary frictionless market. Real trading involves spread, commission, and overnight swap, all of which erode marginal edges — sometimes entirely.
Before trusting any validation result:
- Rebuild your backtest with realistic spread and commission for your actual account type
- Check swap costs if you hold positions overnight, particularly on carry-sensitive pairs
- Compare execution on an ECN/raw account versus a standard account, since costs differ meaningfully
- Use PipTax's cost tool at [/audit.html](/audit.html) to model realistic Pepperstone or IG cost structures against your strategy's trade frequency and holding period
If your edge only survives with zero costs, it isn't an edge — it's a mirage that will evaporate the moment you go live, regardless of how disciplined your validation otherwise was.
Practical Steps to Reduce Overfitting Risk
Building overfitting resistance in from the start is far easier than detecting it after the fact. Practical habits:
- Favour simplicity — fewer parameters, simpler logic, rules you can explain in one sentence
- Test across multiple pairs — a genuine edge on EUR/USD often shows up, in weaker form, on GBP/USD too
- Use wide parameter ranges in optimisation — if performance only holds within a razor-thin parameter window, that's a fragility signal
- Separate research from execution accounts — don't let live discretionary decisions leak back into your "systematic" testing
- Re-validate periodically — a strategy validated on 2019-2022 data needs checking again as 2023-2025 data arrives; markets change regime
For manual, discretionary traders, the same principle applies without code: if you find yourself building a rule around one specific losing trade you remember vividly, ask whether it would have helped across your last 50 trades, not just that one.
Bringing It Together
Detecting overfitting isn't a single test you run once and forget — it's an ongoing discipline that sits alongside every other part of your validation process, from backtesting through to live cost tracking. Combine walk-forward analysis, genuine out-of-sample holdouts, realistic cost modelling via the [cost tool](/audit.html), and a healthy scepticism toward any backtest that looks too clean, and you'll filter out most curve-fit systems before they cost you real money.
Trading remains genuinely difficult, and most retail accounts still lose even with rigorous validation — robust testing reduces false confidence, it doesn't create an edge that isn't there. For the next step in this module sequence, and to compare how execution and costs vary across regulated brokers, see the [brokers directory](/brokers/index.html) and the course [methodology page](/methodology.html) explaining how PipTax builds its own testing standards. Continue to the next lesson via [/school/index.html](/school/index.html).
Key takeaways
- Overfitting happens when a strategy is tuned to fit historical noise rather than a genuine market edge — it will look brilliant in backtests and struggle live
- Warning signs include too many parameters, curve-hugging equity, and results that fall apart when you shift the test window slightly
- Walk-forward analysis and true out-of-sample testing are the two core defences every advanced trader should run before risking real capital
- Always test with realistic spreads, commissions and swaps included — a strategy that only survives on zero-cost backtests is already fragile, so use the cost tool at /audit.html to model this properly
- Fewer parameters, simpler logic and testing across multiple instruments and regimes all reduce the risk of building a curve-fit system
- Overfitting detection is a discipline, not a one-off check — re-validate periodically as new data arrives
Frequently asked questions
- What's the simplest sign a forex strategy is overfitted?
- The clearest sign is an equity curve that's almost perfectly smooth in the backtest but degrades sharply the moment you test it on data the optimiser never saw. If performance collapses out-of-sample, the strategy was likely fitted to noise rather than a real pattern.
- How many parameters is too many for a trading rule?
- There's no hard number, but as a rough guide, if you've got more than three or four adjustable inputs (moving average lengths, RSI thresholds, stop multipliers, session filters, etc.) you're in higher-risk territory. Every extra parameter gives the optimiser more freedom to fit historical noise.
- Is walk-forward analysis really necessary, or is a simple backtest enough?
- A single backtest tells you how a strategy performed on one static dataset with the benefit of hindsight in choosing parameters. Walk-forward analysis re-optimises on rolling windows and tests forward on unseen data each time, which much more closely mimics how you'd actually trade the system live.
- Does including trading costs really change whether a strategy looks overfitted?
- Yes, significantly. Many marginal edges only survive on paper because the backtest ignored spread, commission and swap. Run the same strategy through the cost tool at /audit.html using realistic Pepperstone or IG figures and thin edges often vanish entirely, which is itself a form of overfitting to a frictionless world.
- Can overfitting happen with manual, discretionary trading too?
- Yes. If you review your last 50 losing trades and build a new rule specifically to avoid those exact setups, you're curve-fitting by hand. The same validation mindset - test the rule forward, on fresh data, before trusting it - applies whether the strategy is coded or discretionary.