Home › FX Trading School › Advanced
Building a Clean Data Pipeline for Backtests
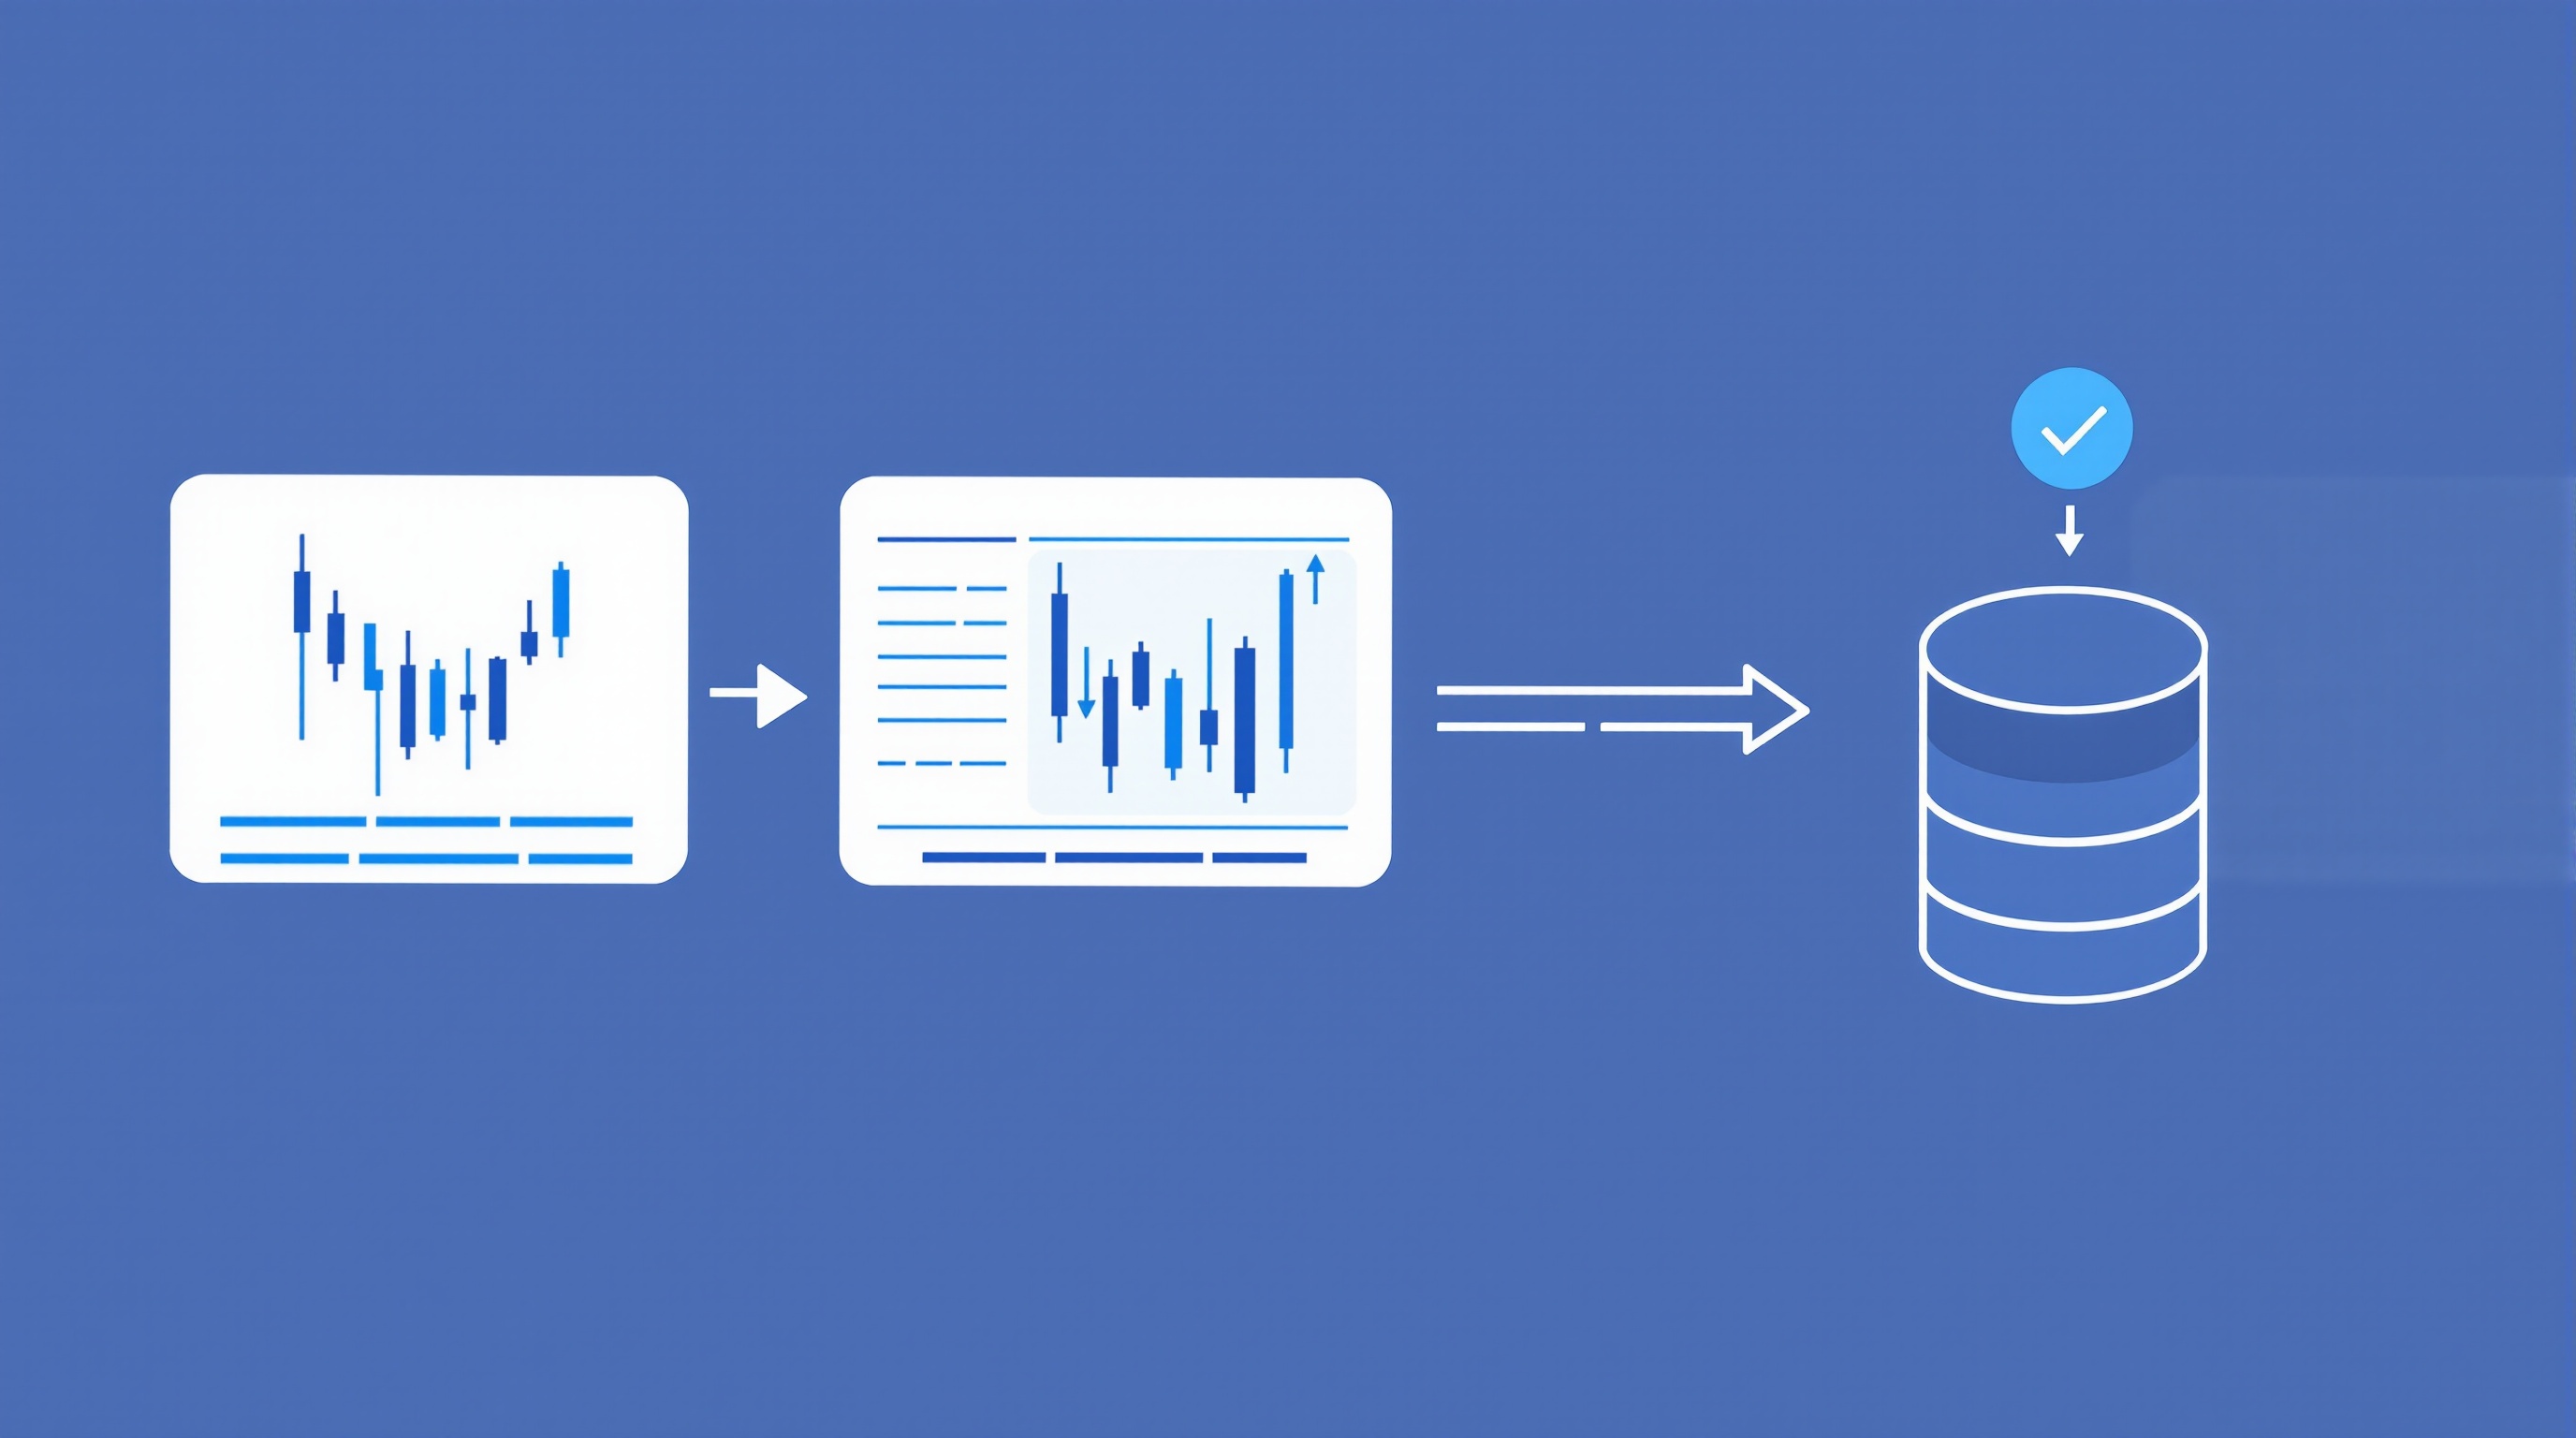
Building a clean data pipeline for backtests is the unglamorous work that decides whether your systematic trading results mean anything at all. This lesson builds on the strategy design and backtesting fundamentals covered earlier in Module 16, and assumes you're already comfortable with the idea of a defined, rules-based system — here we focus purely on the data that feeds it.
Why the Pipeline Matters More Than the Strategy
It's tempting to spend all your time on entry logic and none on the data underneath it. That's backwards. A backtest is only as trustworthy as the data it runs on, and FX data has more failure points than most traders assume:
- Gaps and missing bars from feed outages or low-liquidity periods
- Duplicate or out-of-order timestamps from merging multiple sources
- Weekend and holiday artefacts that create false gaps or phantom candles
- Symbol and pip-value mismatches between brokers and data vendors
- Silent re-quotes in historical feeds, especially around news events
None of these show up as obvious errors. Your backtest will still run, still produce an equity curve, still look plausible. That's the danger — bad data doesn't crash your test, it just quietly lies to you. A pipeline is the discipline of catching these lies before they reach your results.
The Four Stages of a Clean Pipeline
Think of the pipeline as four distinct jobs, each with its own checks. Don't skip stages just because the data "looks fine" — that's exactly when problems hide.
1. Sourcing — pull raw data from a broker platform (e.g. MetaTrader history from Pepperstone's servers, or an export from IG's own platform), a data vendor, or a public dataset. Note the source and pull date for every file. 2. Cleaning — remove duplicates, fill or flag gaps, correct obvious outliers (a one-tick spike to double the price is a feed error, not a real move). 3. Normalising — align timestamps to a single timezone, standardise symbol names, and confirm pip values and contract sizes match your intended instrument. 4. Validating — cross-check a sample against a second source or a known event (e.g. does your data show the expected volatility spike around a major data release?).
Each stage should produce a dataset you could hand to someone else with a short note explaining what was done to it. If you can't explain a transformation in one sentence, don't apply it.
Tick Data vs Bar Data: Choosing the Right Granularity
Not every strategy needs tick-level precision, and pulling it when you don't need it just adds cleaning overhead.
| Use case | Recommended granularity | Why | |---|---|---| | Scalping / execution-sensitive systems | Tick data | Entry timing within seconds matters | | Intraday swing systems | 1-minute to 15-minute bars | Enough detail without excessive noise | | Daily/position systems | Hourly to daily bars | Regime and trend matter more than exact fills | | Cost-sensitivity testing | Tick data (for spread capture) | Need to see actual bid/ask behaviour |
If you're testing how spread and slippage affect a strategy, bar data alone won't cut it — you need to see the bid/ask spread as it actually moved, not just a single close price. That's a separate concern from your average cost assumptions, which you should validate independently using the cost tool.
Common Data Traps That Invalidate Backtests
Three biases account for most "too good to be true" backtest results:
- Survivorship bias — testing only on instruments or brokers that still exist today, ignoring the ones that were delisted, restructured, or went under. If your dataset only includes symbols currently offered, you've quietly excluded failures.
- Look-ahead bias — using information in your backtest that wouldn't have been available at that point in time, such as a revised economic figure instead of the originally released one, or a corrected price that wasn't visible live.
- Gap-filling that invents price action — some cleaning tools interpolate missing bars by smoothly connecting the surrounding prices. That interpolated data never actually traded, and a strategy that "enters" during it is trading a fiction.
The fix for all three is the same: document every transformation, and periodically test your pipeline against a small, manually verified sample where you know the real history. If your cleaned data diverges from what you know actually happened, the pipeline — not the strategy — is broken.
Handling Broker-Specific Quirks
FX data isn't universal even for the "same" pair. Server time, session definitions and symbol conventions differ between platforms and even between servers at the same broker. When building a data pipeline for backtests that draws from more than one source, normalise these explicitly:
- Server time offsets — Pepperstone's various MetaTrader servers may report timestamps in different base timezones; convert everything to a single reference (UTC is the standard choice) before merging.
- Symbol suffixes — brokers append different suffixes to pairs (e.g. for micro-lots or specific server types); map these to a consistent internal naming scheme.
- Weekend and rollover handling — confirm how your source treats the Friday close/Sunday open gap, since some feeds insert a flat bar and others simply skip it.
- Platform differences — data pulled from IG's own platform won't always align tick-for-tick with a MetaTrader export of the same pair, even from a comparable time window, because of differences in liquidity providers and aggregation.
None of this means one broker's data is "wrong" — it means you must be explicit about which source you're using and consistent in how you treat it, so your results reflect the strategy rather than an artefact of data plumbing.
Storing, Versioning and Reusing Your Data
A pipeline you rebuild from scratch every time you test an idea is a pipeline that will eventually give you two different answers to the same question. Treat your cleaned data as a versioned asset:
- Store raw and cleaned files separately — never overwrite the raw pull
- Timestamp every dataset with the pull date and source
- Keep a short changelog of cleaning rules applied (e.g. "removed 14 duplicate ticks, filled 3 gaps under 2 minutes")
- Re-run validation checks whenever you update or extend a dataset
- Separate your price data entirely from your cost assumptions (spread, commission, swap), and update the latter independently
This last point matters more than it seems. Spreads and commissions change, and a backtest with hardcoded, out-of-date costs will quietly overstate profitability. Before trusting any equity curve, check current live costs on PipTax's cost tool and compare them against what your backtest assumed — the gap between the two is often where "great in testing, poor live" strategies come from.
Conclusion: Treat the Pipeline as Part of the System
A clean data pipeline for backtests isn't a side task before the "real" work of strategy design — it's part of the system itself, with the same standards of rigour, documentation and version control you'd apply to your entry and exit rules. Get the sourcing, cleaning, normalising and validating stages right, be honest about tick-versus-bar tradeoffs, watch for survivorship and look-ahead bias, and keep cost assumptions separate and current. None of this guarantees a profitable strategy — most retail trading accounts lose money, and no amount of clean data changes that risk — but it does guarantee that whatever result you get is actually telling you something true about the past, which is the minimum bar for trusting it with real money.
Key takeaways
- A data pipeline for backtests needs sourcing, cleaning, storage and validation stages — skipping any one of them quietly invalidates your results
- Tick data and bar data answer different questions; choose based on what your strategy actually trades on, not what's easiest to download
- Survivorship bias, look-ahead bias and gaps are the three most common ways clean-looking data lies to you
- Broker-specific quirks (server time, weekend gaps, symbol suffixes) must be normalised before data from Pepperstone, IG or any other source is comparable
- Version and timestamp every dataset you backtest on, so a result can be reproduced exactly months later
- Spreads and commissions used in a backtest are assumptions, not facts — check current costs with the cost tool before trusting any equity curve
Frequently asked questions
- What's the difference between tick data and bar (OHLC) data for backtesting?
- Tick data records every price change as it happens; bar data compresses that into fixed intervals (e.g. every minute or hour) with an open, high, low and close. Tick data gives you far more precision — useful for scalping or execution-sensitive strategies — but it's larger, messier and harder to clean. Bar data is lighter and fine for swing or position strategies where you're not fighting for a few pips of entry timing.
- Can I just use MetaTrader's built-in history for backtesting?
- You can, and it's a reasonable starting point, but MT4/MT5 history is only as good as the broker feed it came from, and different servers (even within the same broker, like Pepperstone's various MetaTrader servers) can have gaps or slightly different pricing. Treat it as raw material to clean and validate, not a finished dataset.
- How much historical data do I actually need?
- Enough to cover multiple market regimes — trending, ranging, high and low volatility — not just a bull run or a quiet year. As a rough guide, several years of data across at least one full economic cycle is more useful than a longer dataset that only covers one type of market.
- Does data pipeline quality really matter more than the strategy itself?
- It matters just as much, arguably more, because a flawed pipeline makes every strategy look better or worse than it really is. A mediocre strategy tested on clean data at least gives you an honest answer. A brilliant strategy tested on dirty data gives you a confident, wrong answer.
- Where do live spread and commission figures fit into this?
- They don't belong in your raw data pipeline — they belong in a separate cost-assumptions layer that you update regularly. Use PipTax's cost tool to pull current, broker-specific numbers before you apply them to your backtest, rather than hardcoding old figures into your dataset.