Home › FX Trading School › Intermediate
Candlestick Patterns That Actually Matter (Module 7)
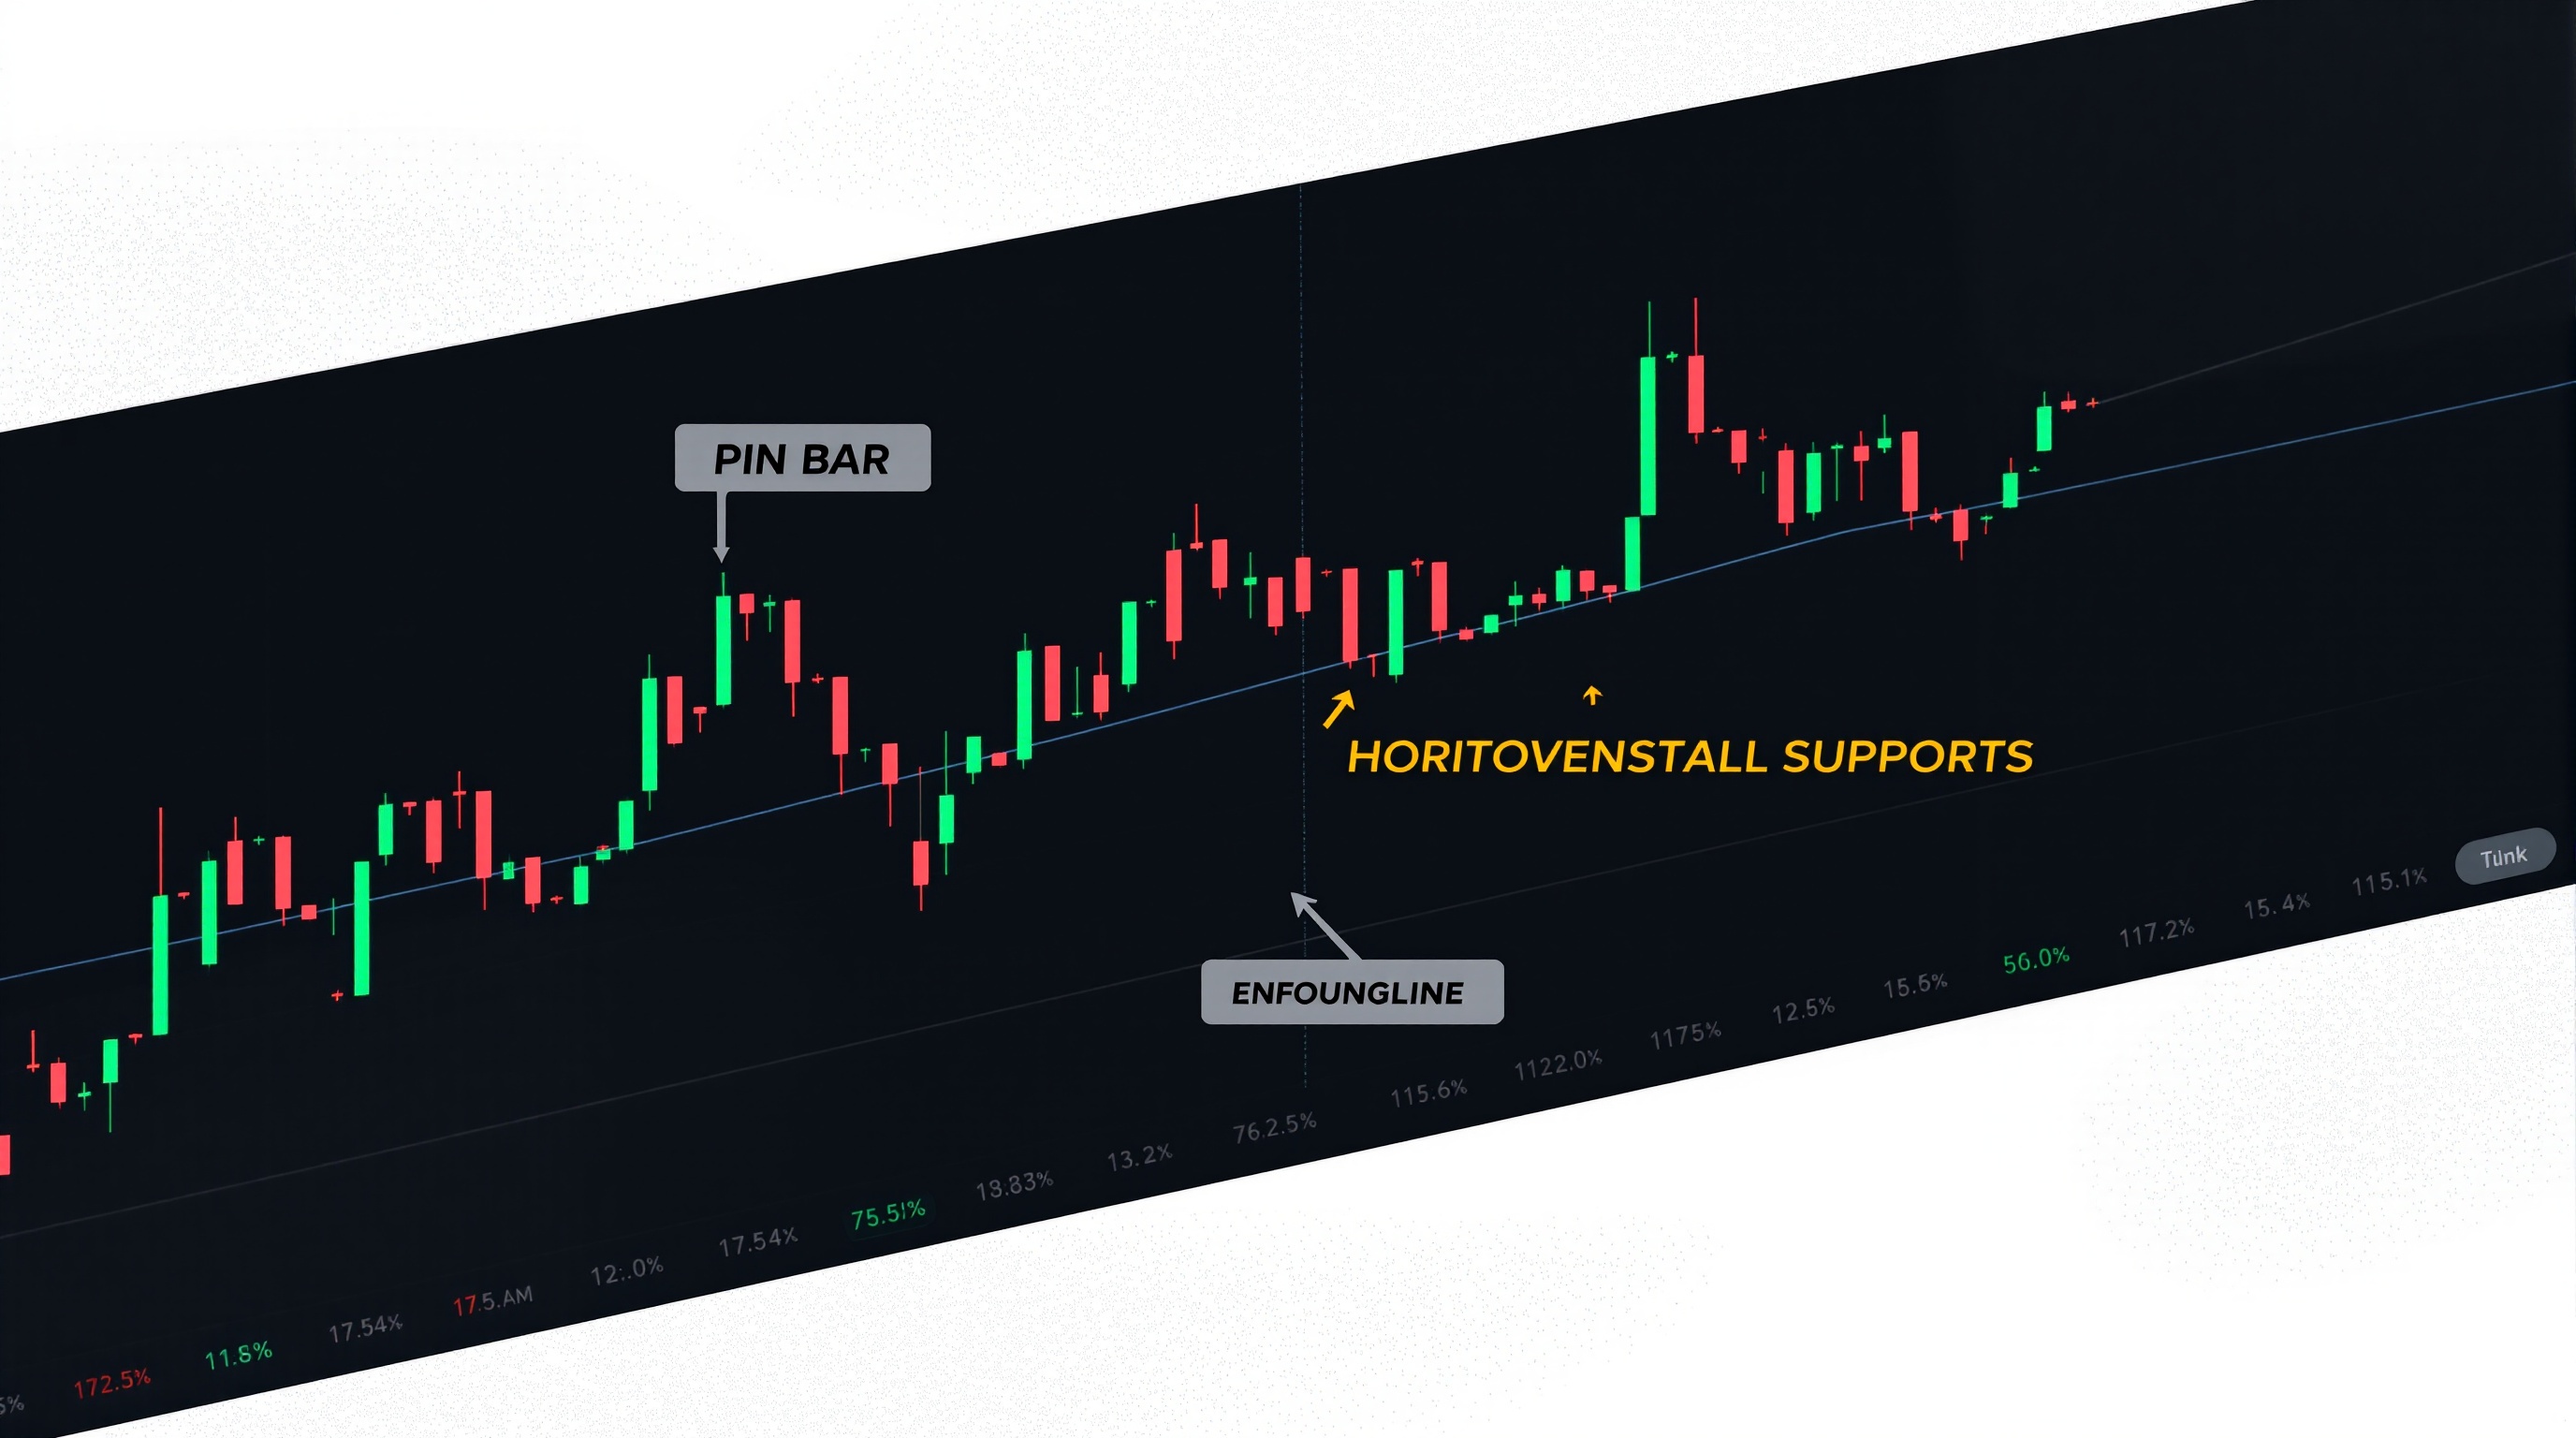
Candlestick patterns that actually matter are a small handful of shapes and formations that show up often enough, and mean enough, to be worth your attention — everything else is noise dressed up as signal. This lesson is Module 7 of the PipTax FX Trading School, and it builds directly on Module 6's work on support and resistance: candlestick patterns without a level to react to are just pretty pictures.
Why most candlestick pattern lists are a waste of time
Search "candlestick patterns" and you'll find charts with 30, 50, sometimes 100 named formations — three white soldiers, abandoned baby, hanging man, and so on. In practice, most of these are rare, hard to identify consistently, and carry little statistical edge on their own in fast-moving forex pairs.
What actually matters:
- Context first, shape second. A pin bar at a random point mid-range means far less than the same pin bar at a level you already marked as important.
- Frequency. Patterns that appear once a year aren't useful for a working trading routine — you need things you'll actually see on the charts you follow.
- Simplicity. The patterns worth learning can be spotted in a few seconds, without arguing over whether a wick is "long enough."
This lesson focuses on five patterns that meet all three criteria: the pin bar, the engulfing candle, the inside bar, the doji, and the two-bar reversal. Learn to read these well on a couple of pairs and timeframes you actually trade, rather than memorising a long list you'll never apply under pressure.
The five candlestick patterns worth learning
1. Pin bar (rejection candle) A long wick with a small body, showing price pushed one way and got firmly rejected. Best read at support/resistance or a round number, not in open space.
2. Engulfing candle One candle's body fully covers the previous candle's body. A bullish engulfing after a pullback in an uptrend is a classic continuation cue; the same shape at a fresh high can flag exhaustion.
3. Inside bar A small candle that sits entirely within the range of the previous (larger) candle — a pause, often before continuation. Useful on higher timeframes (H4, daily) where it reflects genuine consolidation rather than random noise.
4. Doji Open and close are close together, showing indecision. On its own it's weak; after a strong trend leg, into a known level, it's worth watching for a follow-through candle.
5. Two-bar reversal A strong trend candle followed immediately by an equally strong candle in the opposite direction. Simple, visual, and easy to spot without debate.
Notice none of these require exotic naming conventions — that's deliberate.
Reading candlestick patterns in context, not isolation
A candlestick pattern is a question, not an answer. Before you act on one, ask:
- Where is it? At a level from your prior analysis (support, resistance, a prior swing high/low), or in the middle of nowhere?
- What came before it? A pin bar after a five-candle rally means something different to one after a slow grind sideways.
- What's the higher timeframe doing? A bullish reversal pattern on the M15 chart against a strong daily downtrend is a lower-probability trade than one aligned with the bigger picture.
- Is there confluence? Two or three things agreeing — level, pattern, trend direction — is far more useful than a pattern in isolation.
This is why Module 6 (support and resistance) is a prerequisite: candlestick patterns are the trigger, but the level is the setup. Trade the trigger without the setup and you're essentially trading randomness with extra steps.
A simple candlestick pattern checklist
Before entering on any candlestick pattern, run through this list:
1. Is price at a level I identified in advance — not one I've just drawn to fit the candle? 2. Does the candle close clearly, not just poke through the level and drift back? 3. Does the pattern align with the higher-timeframe trend, or am I fighting it? 4. Is there a sensible place for a stop-loss just beyond the pattern's extreme? 5. Does the potential reward justify the risk once realistic costs are included?
That last point matters more than most traders admit. A pattern might look textbook-perfect, but if the pair's typical spread and any commission eat a large chunk of a tight stop, the trade's edge can vanish before it's even started. Run the numbers for your actual pair and account type in PipTax's cost tool before sizing a candlestick-based trade — the same setup can look very different on a standard account versus a raw-spread-plus-commission account.
Where broker platform and data quality affect candlestick reading
Candlestick shapes depend on the price feed drawing them, and feeds differ slightly between brokers and platforms.
- MetaTrader (MT4/MT5) vs proprietary platforms: Pepperstone offers MetaTrader servers alongside cTrader, while IG runs its own platform as well as MetaTrader access. The same candle on the same pair can close fractionally differently between feeds because of how each broker's liquidity providers price it.
- Timeframe consistency: check your platform's candle close times (broker server time vs UTC) — a "daily candle" pattern read at the wrong close time isn't the pattern you think it is.
- Weekend gaps and thin liquidity: Sunday-open candles and low-liquidity periods (holidays, very late UK evening) can produce odd-looking wicks that aren't reflecting genuine rejection, just thin order books.
None of this means one broker's charts are "wrong" — it means you should read patterns on the platform and account type you'll actually trade with, and confirm specifics (execution model, available platforms) on PipTax's brokers page rather than assuming every feed behaves identically.
Common mistakes traders make with candlestick patterns
- Pattern-hunting in isolation — scrolling charts looking for shapes rather than starting from a level or trend and waiting for a pattern to form there.
- Ignoring the higher timeframe — a perfect-looking reversal candle on M5 against a strong H4 trend is fighting the tide.
- Overtrading dojis — indecision candles are common; treat them as a pause signal, not a standalone trade trigger.
- Forgetting costs — a small pattern on a tight stop can be dominated by spread and commission; always check real costs before sizing, not after.
- No stop discipline — the whole point of a clean pattern is a clean invalidation point; if price closes back through it, the setup has failed, and the trade should be managed or closed accordingly.
Candlestick patterns that actually matter earn their place by being simple, frequent, and read in context — not by having the most exotic name. Keep your list short, always pair patterns with a level and a higher-timeframe view, and check real trading costs with PipTax's cost tool before committing size to any setup. Trading forex carries real risk of loss, and no pattern — however textbook — removes that.
Key takeaways
- Stick to a short list of high-frequency, easy-to-spot patterns: pin bar, engulfing candle, inside bar, doji, two-bar reversal.
- A candlestick pattern means little without context — it must align with a pre-identified support/resistance level and the higher-timeframe trend.
- Run a simple checklist (level, close quality, trend alignment, stop placement, reward vs cost) before acting on any pattern.
- Price feeds can differ slightly between platforms, such as Pepperstone's MetaTrader/cTrader servers versus IG's own platform — read patterns on the platform you'll actually trade.
- Always check real spread and commission costs in PipTax's cost tool before sizing a trade off a candlestick pattern, since costs can erode a tight-stop setup.
- Trading carries genuine risk of loss; no candlestick pattern removes that risk, however clean it looks.
Frequently asked questions
- What is the single most reliable candlestick pattern?
- There isn't one universally 'most reliable' pattern — reliability depends on context. That said, the pin bar and engulfing candle tend to be the most useful because they're frequent, easy to spot, and work well when combined with a clear support or resistance level.
- Do candlestick patterns work on all timeframes?
- They appear on all timeframes, but they tend to be more meaningful on higher timeframes (H4, daily) where a pattern reflects more genuine order flow rather than short-term noise. Lower timeframes produce more patterns but with a weaker signal-to-noise ratio.
- Should I trade a candlestick pattern on its own, without other analysis?
- It's not recommended. This lesson builds on Module 6's support and resistance work specifically because patterns are far more useful when they form at a level you've already identified and align with the broader trend, rather than being traded in isolation.
- Can candlestick patterns look different between brokers like Pepperstone and IG?
- Yes, slightly. Differences in liquidity provider pricing and platform (for example Pepperstone's MetaTrader/cTrader servers versus IG's own platform) can produce minor variations in how a candle closes. Always read patterns on the platform and account you actually trade with.
- How do trading costs affect candlestick pattern trades?
- A pattern might offer a tight, clean stop-loss, but if spread and commission are a large proportion of that stop distance, the real risk/reward is worse than it looks on the chart. Check live costs for your pair and account type using PipTax's cost tool before sizing the trade.