Home › FX Trading School › Beginner
Candlestick Basics for Beginners: Reading Price Action
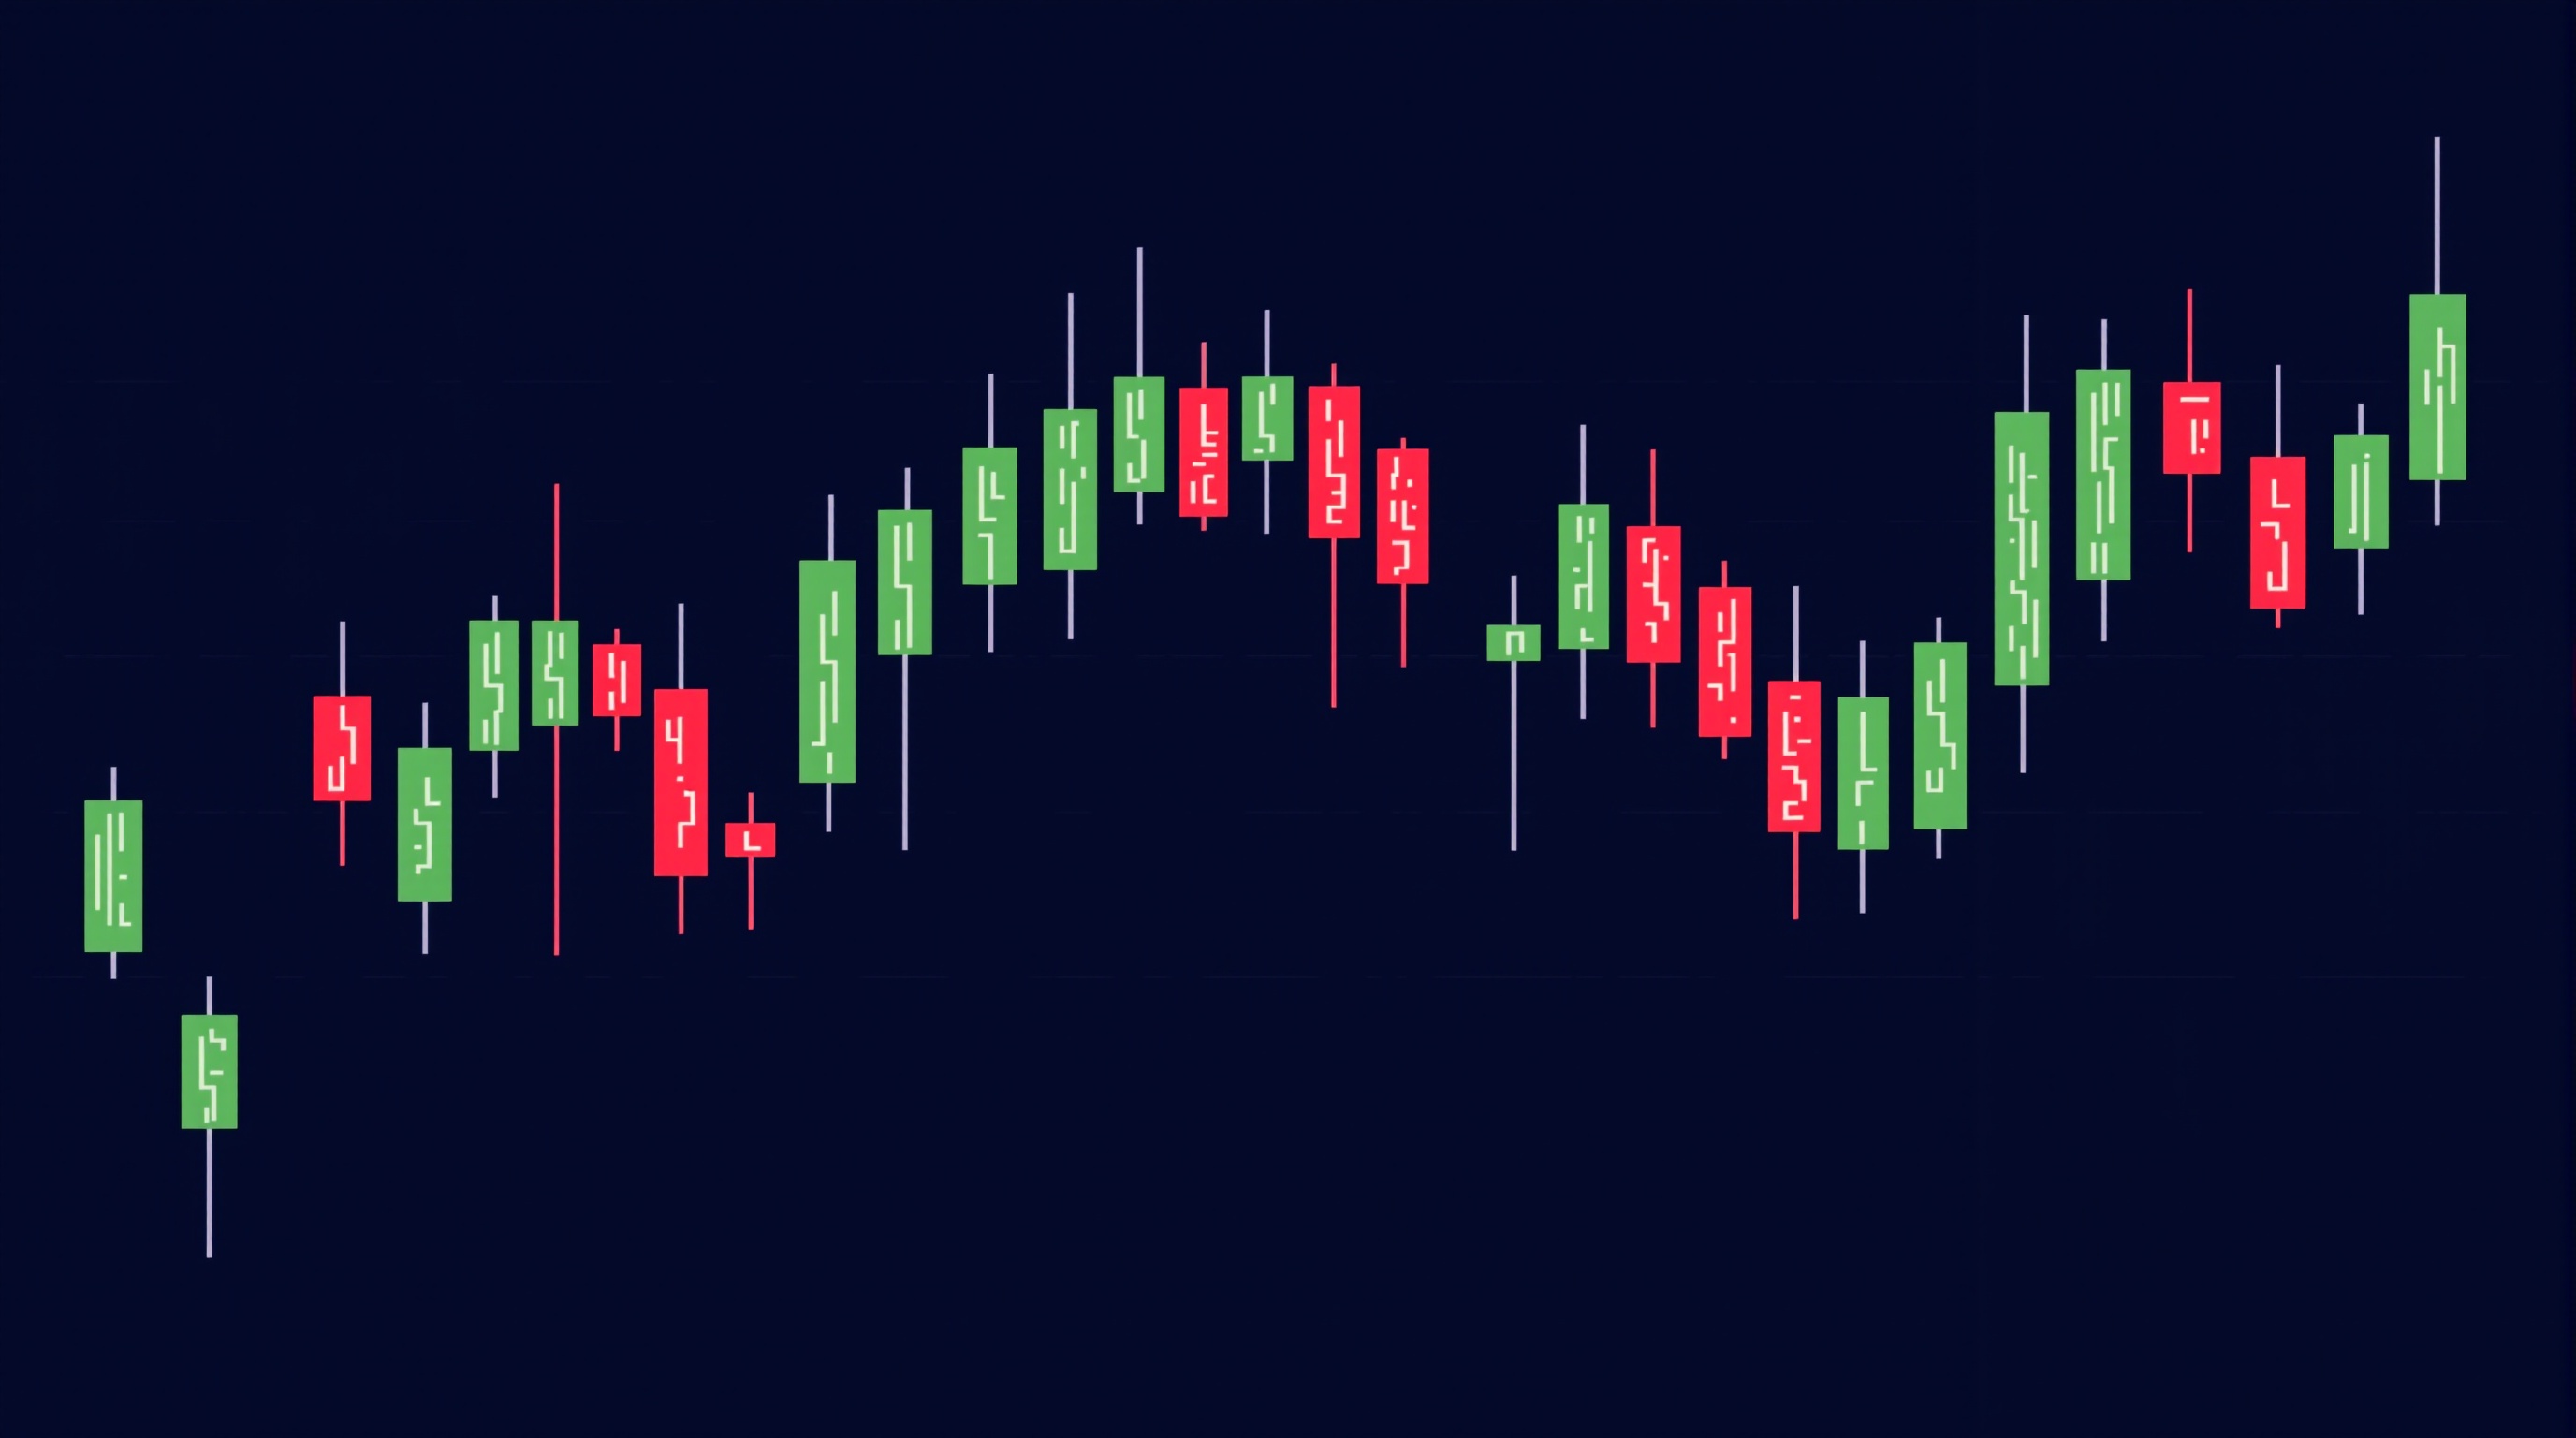
Candlestick basics for beginners start with one simple idea: a candlestick is just a picture of price over a set period of time. Once you can read that picture, you can read almost any forex chart — whether it's on Pepperstone's MetaTrader platform or IG's own charting package.
This lesson is part of Module 2: Charts & Orders in the PipTax FX Trading School. It builds directly on the earlier module on chart types and timeframes — if you haven't covered how timeframes work yet, it's worth doing that first, because everything below assumes you understand that a chart is built from repeating time periods (e.g. one candle per hour, per day, and so on).
What a Candlestick Actually Shows
Every candlestick represents four prices for its chosen time period:
- Open — the price when the period started
- High — the highest price reached during the period
- Low — the lowest price reached during the period
- Close — the price when the period ended
These four values are often shortened to OHLC. A 1-hour candle on the EUR/USD chart, for example, shows exactly what happened to price during that single hour — nothing more, nothing less.
The candlestick has two visual parts:
1. The body — the thick block between the open and close price 2. The wicks (or shadows) — the thin lines above and below the body, showing the high and low
If the close is higher than the open, the candle is usually shown as bullish (often green or blue). If the close is lower than the open, it's bearish (often red). This is a display setting, not a fixed rule — both MetaTrader (used by brokers such as Pepperstone) and IG's platform let you customise these colours.
Reading a Single Candle
Before looking at patterns, get comfortable reading one candle at a time. Ask yourself:
- Is the body big or small? A large body means a strong, decisive move in one direction during that period. A small body means the price opened and closed close together — indecision.
- Are the wicks long or short? Long wicks show that price moved a long way during the period but was pushed back before the close. This can suggest rejection of a price level.
- Which side has the longer wick? A long upper wick shows buying pressure was rejected. A long lower wick shows selling pressure was rejected.
A candle with a tiny body and long wicks on both sides is called a doji — it signals indecision between buyers and sellers. On its own, it's not a signal to buy or sell; it's simply information about market behaviour during that period.
Common Candlestick Patterns Worth Learning First
As a beginner, you don't need to memorise dozens of patterns. Start with these:
| Pattern | What it looks like | What it suggests | |---|---|---| | Doji | Tiny body, wicks both sides | Indecision, possible pause in trend | | Pin bar (hammer/shooting star) | Small body, one long wick | Rejection of a price level | | Bullish engulfing | A large bullish candle that fully covers the previous bearish candle's body | Buyers stepping in strongly | | Bearish engulfing | A large bearish candle that fully covers the previous bullish candle's body | Sellers stepping in strongly |
A few honest points here:
- These patterns describe past buying and selling pressure — they don't guarantee what happens next.
- Context matters more than the pattern itself. A bullish engulfing candle near a well-known support level is more meaningful than the same pattern appearing randomly mid-range.
- Patterns work best combined with other tools you'll meet later in this course — support/resistance, trend structure, and risk management.
Setting Up Candlestick Charts on Your Platform
Both major platforms used by UK traders make this straightforward:
- MetaTrader (MT4/MT5) — available through brokers like Pepperstone. Right-click the chart, choose "Properties," and you can set candle colours, body thickness, and enable/disable wicks.
- IG's own platform — offers similar customisation through the chart settings menu, plus built-in pattern recognition tools on some chart types.
Practical steps to get started:
1. Open a demo account with a regulated broker (see PipTax's [broker comparisons](/brokers/index.html) for FCA-regulated options). 2. Load a major pair like EUR/USD or GBP/USD. 3. Set the timeframe to 1-hour or 4-hour to start — enough candles to see patterns without excessive noise. 4. Scroll back through history and try to identify doji, pin bars, and engulfing patterns before checking what happened next.
This repetition — spotting a pattern, then seeing the outcome — is how pattern recognition becomes genuinely useful rather than just theoretical.
Common Beginner Mistakes
Watch out for these when you're starting out:
- Treating one candle as a full trading signal. A single candle is a data point, not a strategy.
- Ignoring the timeframe. A bearish engulfing pattern on a 1-minute chart carries far less weight than the same pattern on a daily chart.
- Chasing every pattern you see. Not every doji or pin bar matters — location on the chart (near support, resistance, or a trend line) changes the significance considerably.
- Forgetting that candlesticks don't account for trading costs. Your entry and exit decisions based on candle patterns still have to clear the spread and any commission. Use the [cost impact tool](/cost-impact.html) to see how those costs stack up against your typical trade size.
How This Fits Into Your Trading Plan
Candlestick reading is a skill, not a system. Once you're comfortable with candlestick basics for beginners, the next steps in this course cover how to combine that reading with support and resistance levels, and later, with a proper risk management framework. None of this removes the fact that trading carries real risk — most retail accounts lose money, and no chart pattern changes that reality.
Before applying anything you learn here to a live account, check the [FCA-regulated brokers](/brokers/index.html) available to you, confirm live spreads and commissions with the [cost audit tool](/audit.html), and review current [swap rates](/rates.html) if you plan to hold positions overnight. Reading a chart well is only useful if the underlying costs and risk controls are sound too.
Next Steps
Return to the [FX Trading School index](/school/index.html) to continue with the next lesson in Module 2, where we look at support and resistance — the natural follow-on from candlestick reading, since most useful patterns are judged by where they appear on the chart, not just what they look like.
Key takeaways
- A candlestick shows four prices for a chosen period: open, high, low and close (OHLC)
- The body shows the open-close range; the wicks show the high-low extremes reached during that period
- Candle colour tells you direction — up (bullish) or down (bearish) — but colour conventions can be changed in your platform settings
- A handful of patterns (doji, pin bar, engulfing) are worth learning first; the rest can wait
- Candlesticks describe what happened, not what will happen next — always use them alongside a plan and risk management
- Practise reading candles on a demo account with Pepperstone's MetaTrader or IG's own platform before applying it to live decisions
Frequently asked questions
- What is the easiest way to learn candlestick basics for beginners?
- Start with just one candle at a time. Learn what open, high, low and close mean, then practise spotting bullish versus bearish candles on a demo chart before moving on to multi-candle patterns.
- Do all brokers use the same candlestick colours?
- No. Green/red and blue/red are common defaults, but colours are just a display setting. Check your platform's chart properties — on MetaTrader (used by brokers like Pepperstone) and on IG's own platform, you can change bullish and bearish colours to whatever you prefer.
- How many candlestick patterns do I actually need to know?
- As a beginner, focus on three or four: doji, pin bar (hammer/shooting star), and engulfing patterns. These cover most of what you'll see day to day. Add more only once you're confident reading these.
- Can candlestick patterns predict price movement?
- No pattern guarantees a future move. Candlesticks summarise past buying and selling pressure. They're a useful read on market behaviour, but they should be combined with a broader plan, support/resistance levels, and proper risk management.
- What timeframe should beginners use to practise candlestick reading?
- The 1-hour or 4-hour chart is a sensible starting point — enough candles to see patterns form without the noise of very short timeframes like the 1-minute chart.
- Does the candlestick timeframe affect trading costs?
- The candlestick timeframe itself doesn't change spreads or commissions, but how often you trade does. Shorter timeframes usually mean more trades and more cost exposure — use PipTax's cost tool at /audit.html to see how trading frequency affects your total costs.