Home › FX Trading School › Intermediate
Bollinger Bands Explained: A Practical FX Guide
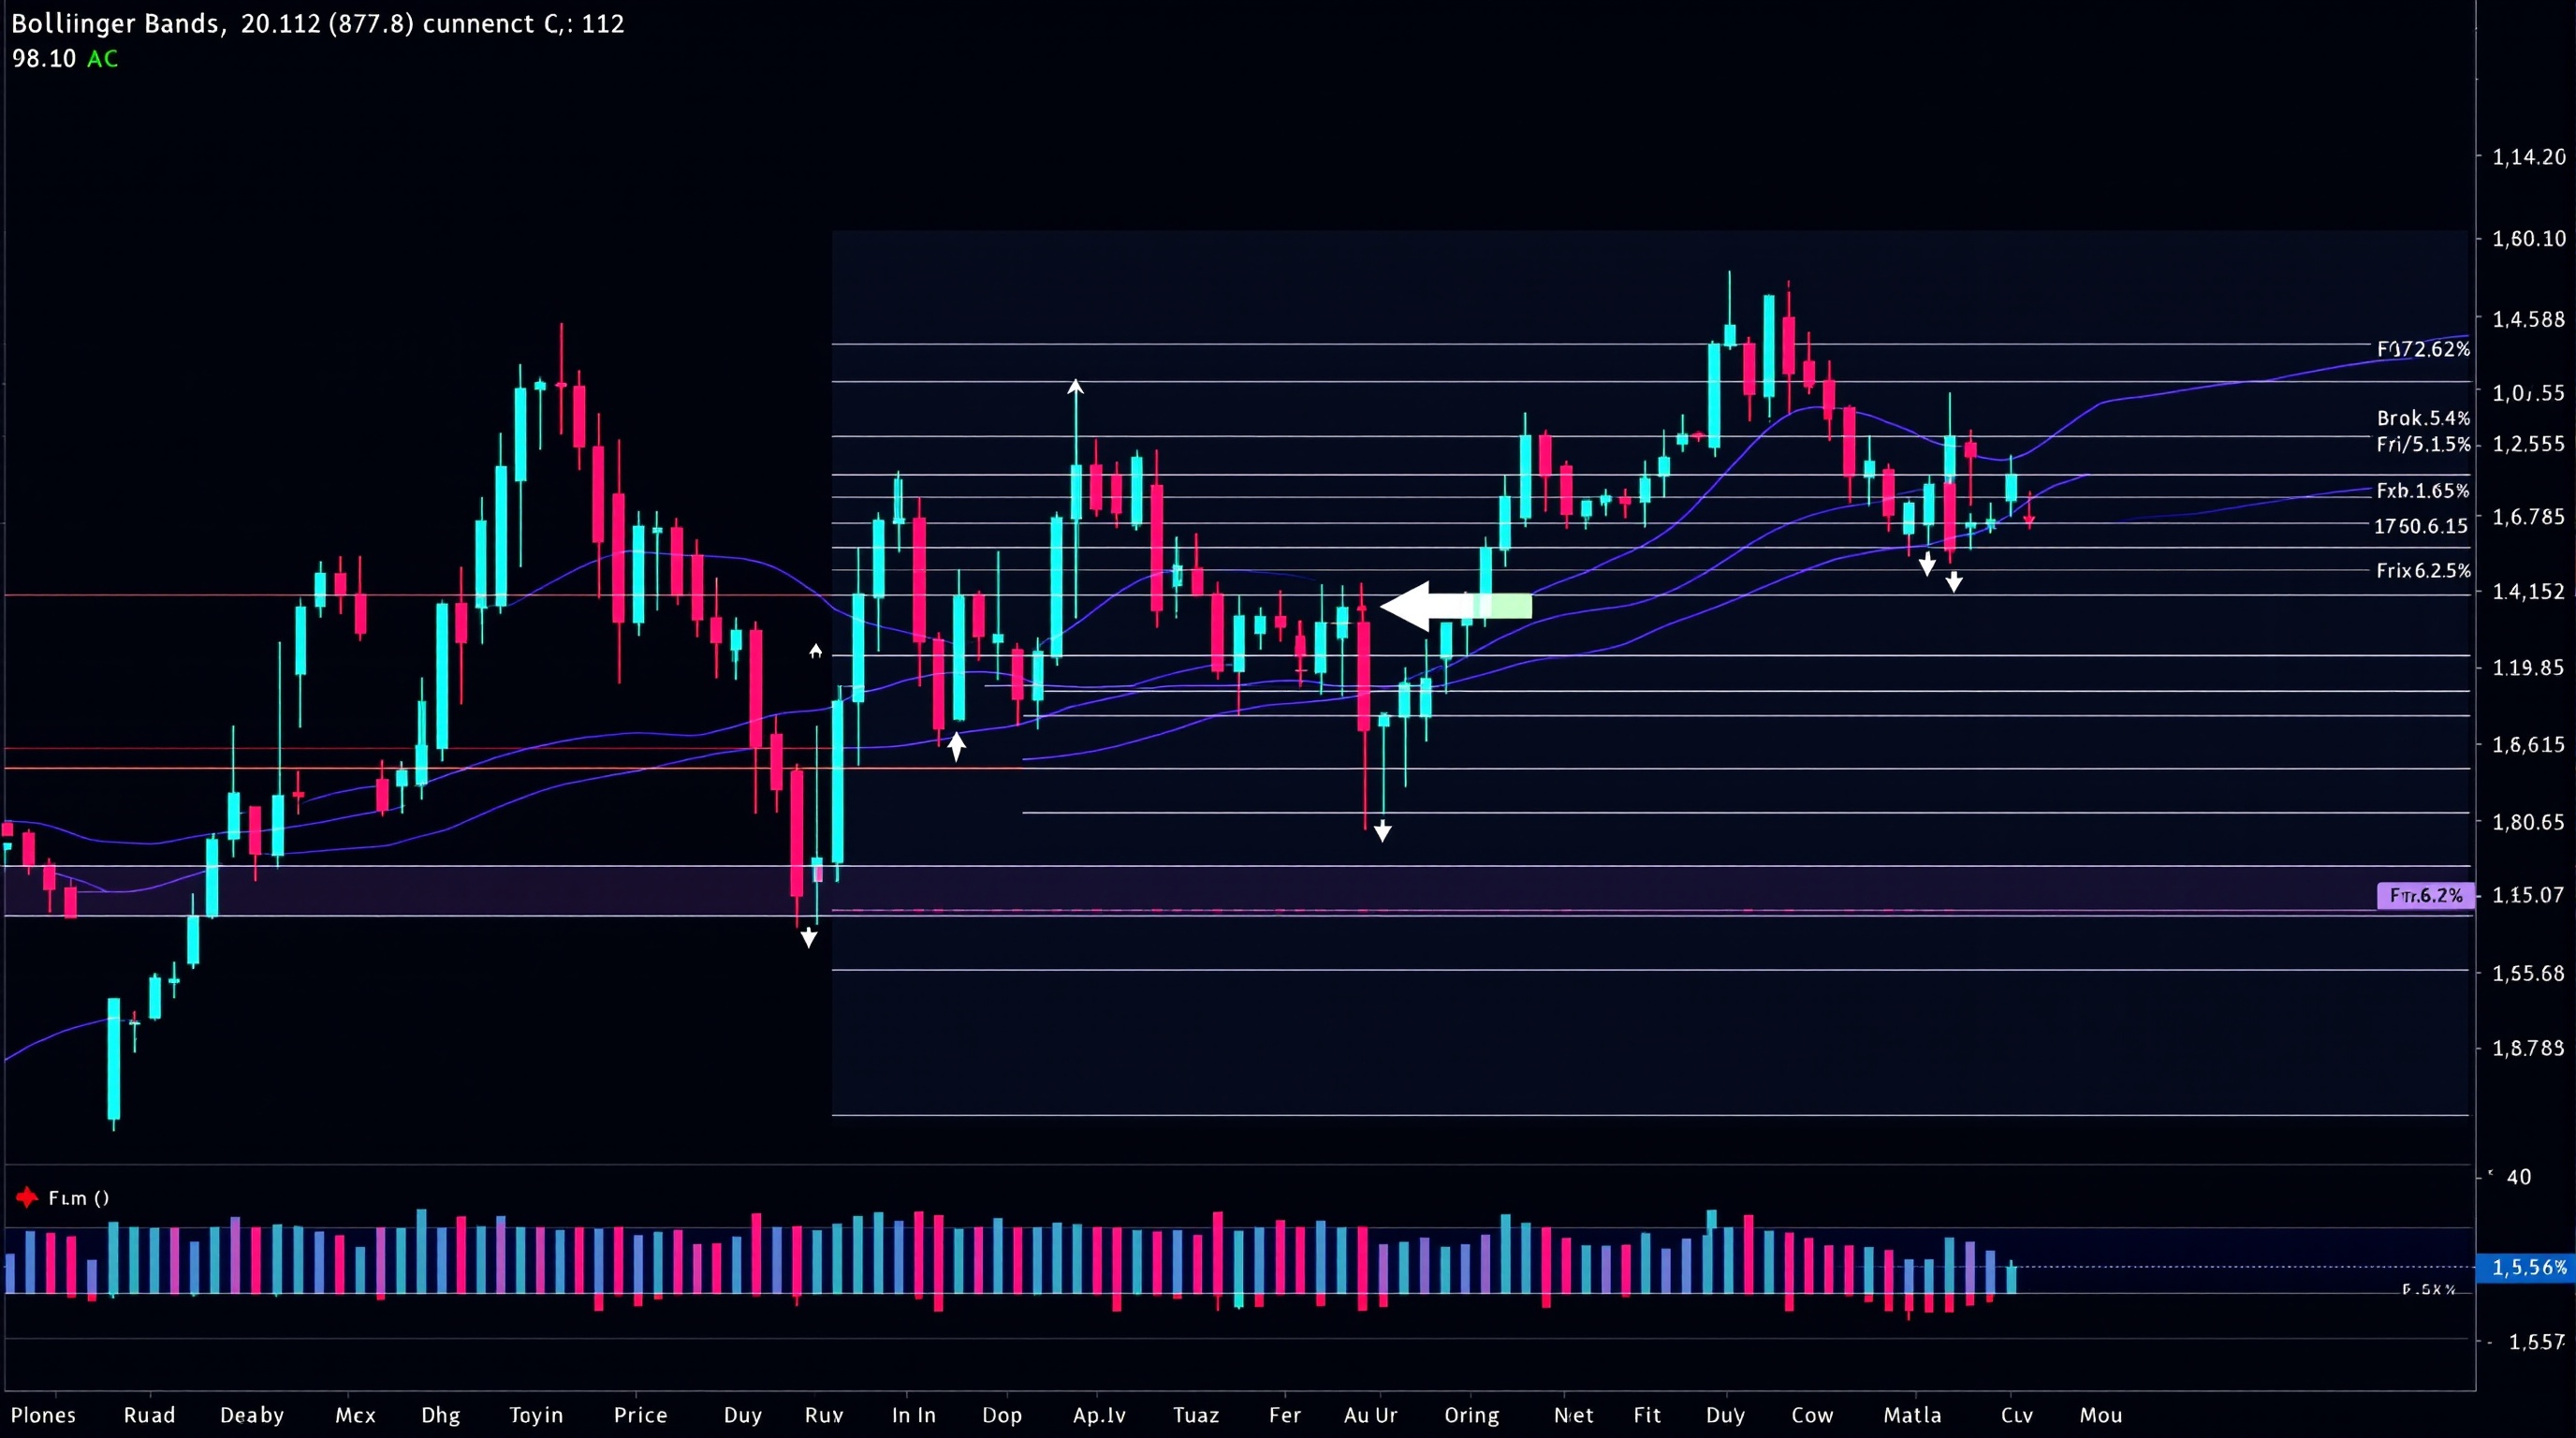
Bollinger Bands explained simply: they're a volatility envelope wrapped around price, built from a moving average plus and minus a multiple of standard deviation, and they're one of the most widely used tools in forex technical analysis. This lesson is part of Module 6 (Technical analysis) in the PipTax FX Trading School, and it assumes you've already covered [moving averages](/school/index.html) and basic support/resistance — if either of those feels shaky, go back a step before you carry on here.
What Bollinger Bands actually measure
Bollinger Bands, created by John Bollinger, plot three lines on your chart:
- Middle band — usually a 20-period simple moving average (SMA).
- Upper band — the middle band plus 2 standard deviations of price.
- Lower band — the middle band minus 2 standard deviations of price.
The key point: standard deviation measures how spread out prices are from the average. When price is calm and ranging tightly, standard deviation shrinks and the bands pull in close together. When price starts moving sharply — a news spike, a session open, a breakout — standard deviation rises and the bands widen out.
This means Bollinger Bands aren't a trend or momentum tool on their own. They're a volatility measure. Everything useful you do with them comes from watching how the bands expand and contract, and where price sits relative to them, rather than treating the upper or lower band as a magic buy/sell line.
Most platforms let you adjust both the moving average length and the standard deviation multiplier. The 20-period/2-deviation setup is the default in MetaTrader and most other platforms for good reason — it's a sensible starting point — but it's a default, not a law.
The squeeze: reading low volatility
The "Bollinger Band squeeze" is when the upper and lower bands pull close together, signalling that volatility has dropped to unusually low levels. Traders watch for squeezes because low volatility often precedes a bigger move — though the squeeze tells you nothing about which direction that move will go.
Practical ways to use a squeeze:
1. Mark it, don't predict it. A tight squeeze flags "something's coming," not "price is going up." 2. Wait for confirmation. Combine the squeeze with a breakout of recent support/resistance, or a candle close outside the bands, before considering a trade. 3. Check the higher timeframe. A squeeze on the 15-minute chart inside a strong daily trend behaves very differently to a squeeze on a quiet Sunday evening session. 4. Respect news risk. Squeezes often build ahead of scheduled data releases — check an economic calendar so you're not surprised by the reason volatility expands.
A squeeze is a heads-up, not a signal in itself.
Band touches and "walking the band"
New traders often assume price touching the upper band means "overbought, sell now" and the lower band means "oversold, buy now." That's a common misreading. In a strong trend, price can hug — or "walk" — the upper or lower band for an extended stretch while the trend keeps running. Selling every upper-band touch in a strong uptrend has stopped out plenty of accounts.
A more balanced read:
- Ranging market: touches of the upper/lower band are more likely to mark short-term extremes, and a reversal back toward the middle band is plausible.
- Trending market: band walking is normal; the middle band (the moving average) often acts as dynamic support or resistance instead.
- Band width matters: bands that are already wide when price touches the edge suggest volatility is high and a snap-back is less predictable than in a narrow-band environment.
Always establish the broader trend context first — using structure, a moving average, or both — before deciding what a band touch means.
Combining Bollinger Bands with other tools
Bollinger Bands work best as one part of a toolkit, not a standalone system. Sensible pairings:
| Tool | What it adds | |---|---| | RSI or Stochastic | Confirms momentum agrees with a band touch | | Trend/structure (higher highs/lows) | Tells you whether to expect reversal or continuation | | Support/resistance levels | Confirms the price zone has independent significance | | ATR | Cross-checks volatility readings from a different formula |
A common intermediate setup: wait for a squeeze, then look for a breakout candle that closes outside the band and is backed by momentum confirmation on RSI, and aligns with the higher-timeframe trend. That's three independent checks agreeing, rather than one indicator making the decision alone.
Setting up Bollinger Bands on your platform
Both Pepperstone and IG support Bollinger Bands natively, whether you trade through MetaTrader 4/5 or, on IG, its own web and mobile platform.
- On Pepperstone's MetaTrader servers, add Bollinger Bands from the Indicators list, then adjust period and deviation in the properties dialog — 20/2 is the default.
- On IG's own platform, Bollinger Bands sit in the indicator library alongside moving averages and oscillators, with the same period/deviation controls.
- Test settings on a demo account first — changing the deviation multiplier from 2 to 2.5, for example, widens the bands and reduces how often price touches them.
- Save your preferred template so every new chart opens with your chosen settings rather than reconfiguring each time.
Platform choice doesn't change what the indicator measures — it only changes how you interact with it.
Costs, spreads, and why this still matters for band trades
Bollinger Band signals often trigger during volatility expansion — exactly when spreads can widen and slippage is more likely, particularly around news. A breakout that looks clean on the chart can cost more to execute than it appears. Before acting on any Bollinger Band setup:
- Check current spreads and any commission structure on your broker's live pricing — PipTax's [cost audit tool](/audit.html) lets you compare this properly rather than guessing.
- Understand how execution costs erode a strategy's edge over time using the [cost-impact tool](/cost-impact.html).
- Compare regulated brokers, including Pepperstone and IG, on the [brokers page](/brokers/index.html) before committing real funds.
- Review overnight financing on the [swap rates page](/rates.html) if any Bollinger Band setup involves holding positions beyond a session.
Conclusion: keeping Bollinger Bands in perspective
With Bollinger Bands explained properly, the takeaway is simple: they show you volatility, not certainty. A squeeze flags potential, a band touch flags a location worth watching, and neither replaces trend context, momentum confirmation, or basic risk management. Trading forex carries real risk of loss, and most retail accounts lose money — no indicator, including this one, changes that. Use Bollinger Bands as one filter among several, check our [methodology](/methodology.html) for how we approach testing tools like this, and always confirm live trading costs before turning any analysis into a real position.
Key takeaways
- Bollinger Bands measure volatility via standard deviation around a moving average — they are not a standalone buy/sell signal.
- A tight 'squeeze' flags that a bigger price move may be coming, but it does not indicate direction.
- In trending markets, price can 'walk' along a band for extended periods — fading every band touch is a common beginner mistake.
- Pair Bollinger Bands with trend structure and a momentum indicator like RSI for more balanced decisions.
- Both Pepperstone (MetaTrader) and IG (own platform) support Bollinger Bands natively with adjustable period and deviation settings.
- Volatility expansion often coincides with wider spreads — check live costs with PipTax's tools before trading a breakout.
Frequently asked questions
- What's the difference between Bollinger Bands and standard deviation?
- Standard deviation is the statistical calculation; Bollinger Bands are the visual application of it, plotting bands at a set number of standard deviations above and below a moving average so you can see volatility shift in real time.
- Should I always buy at the lower band and sell at the upper band?
- No. That only tends to work in ranging markets. In a trending market, price can 'walk' along a band for an extended period, and fading every touch can lead to repeated losing trades against the trend.
- What's the best setting for Bollinger Bands in forex?
- The default 20-period, 2-standard-deviation setup is a solid starting point and is what most platforms, including MetaTrader, load by default. Any change should be tested on a demo account first, since widening the deviation reduces how often price touches the bands.
- Does a Bollinger Band squeeze tell you which direction price will break?
- No. A squeeze only signals that volatility is unusually low and a bigger move may be building. Direction has to be confirmed separately, for example with a breakout of support/resistance plus momentum confirmation.
- Can I use Bollinger Bands on both Pepperstone and IG?
- Yes. Bollinger Bands are available on Pepperstone's MetaTrader platforms and on IG's own platform, with adjustable period and deviation settings on both. The indicator's logic is identical; what differs is the interface.
- Do Bollinger Bands work on all timeframes?
- They can be applied to any timeframe, but the context matters. A squeeze on a lower timeframe within a strong higher-timeframe trend behaves differently to one during a quiet session, so it helps to check the broader trend before acting.