What Slippage Really Costs You and How to Measure It
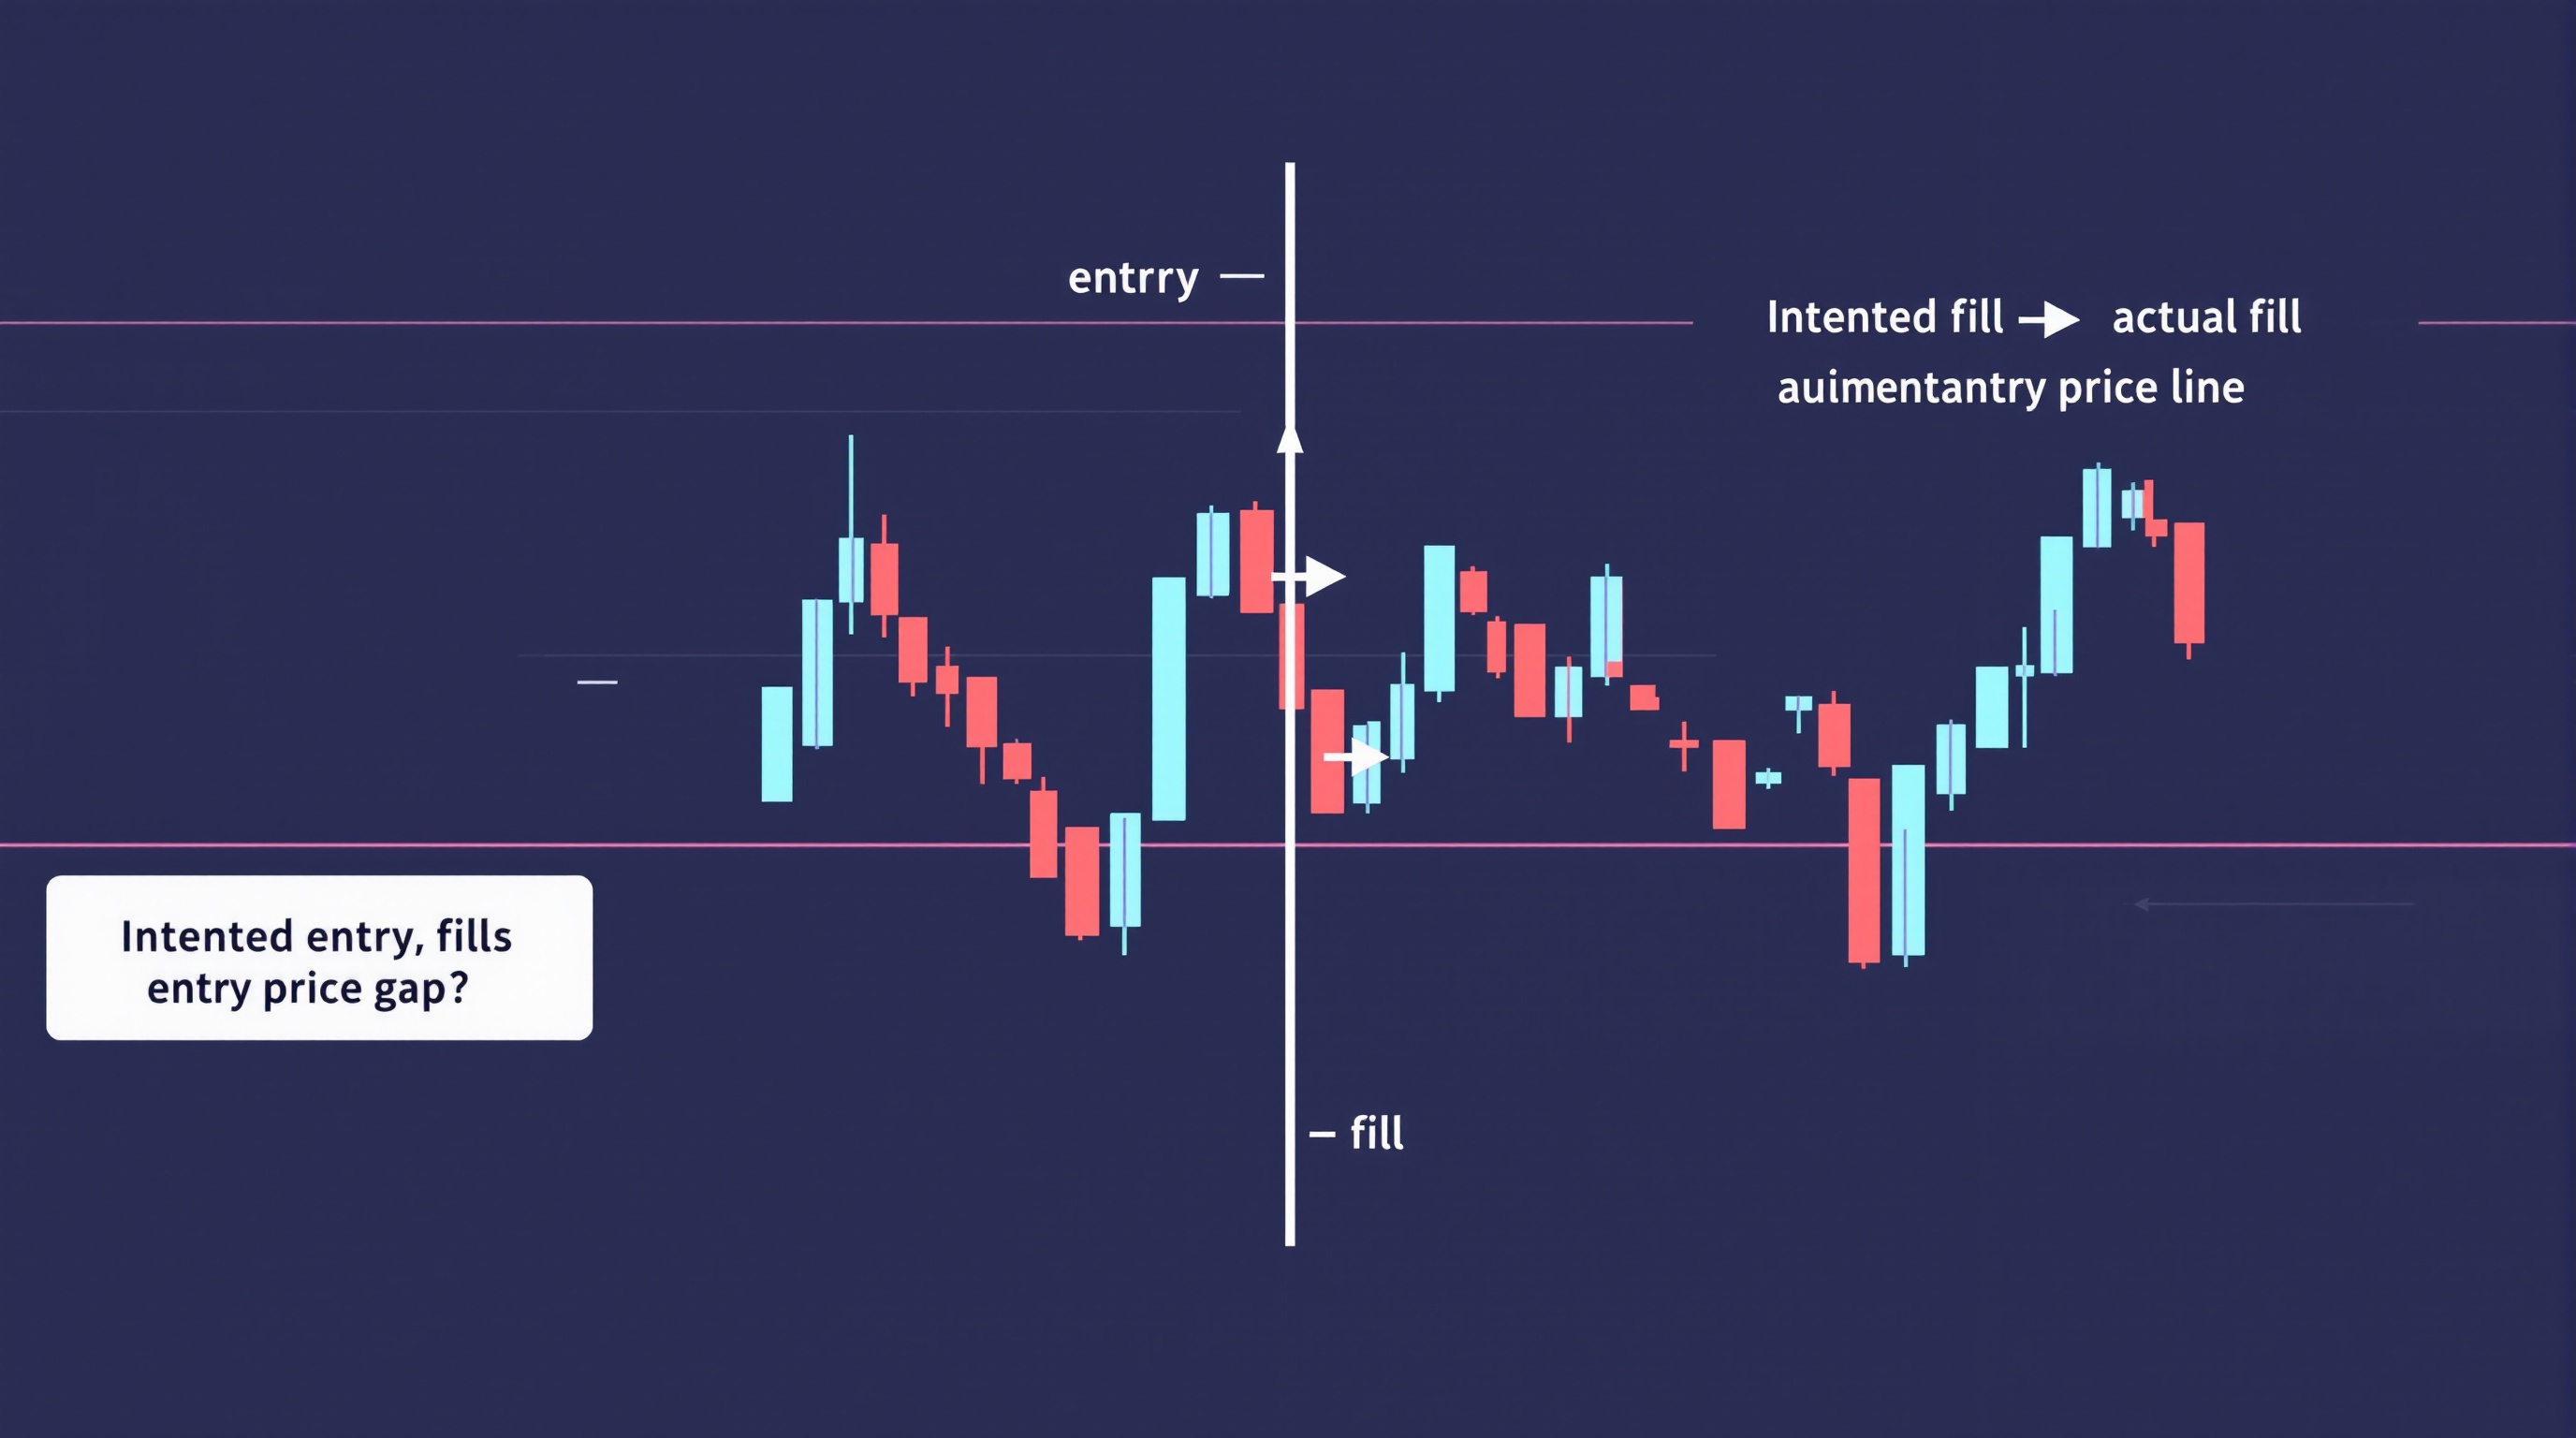
What slippage really costs you is rarely obvious from a single trade — it's the accumulated gap between the price you expect and the price you actually get, repeated across hundreds of orders, that quietly erodes returns. Most traders track spread and commission carefully but never measure slippage at all, which means a real cost is hiding in plain sight.
What Slippage Actually Is
Slippage happens when your order fills at a different price than the one you saw when you clicked "buy" or "sell". It's not a broker error or a conspiracy — it's a natural result of trading in a market where prices move between the moment you place an order and the moment it executes.
There are two directions:
- Negative slippage — you get a worse price than expected (buy higher, sell lower). This costs you money.
- Positive slippage — you get a better price than expected (buy lower, sell higher). This works in your favour.
Slippage tends to increase in specific conditions:
- Fast-moving markets, especially around major news releases
- Low liquidity periods, such as late Friday or during holiday sessions
- Large order sizes relative to available liquidity at the current price
- Wide gaps between sessions, such as weekend opens
On a single trade, a fraction of a pip either way feels irrelevant. Over a year of active trading, the pattern matters far more than any individual instance.
How Slippage Becomes a Real Cost
Think of slippage as a fourth cost sitting alongside spread, commission, and swap. None of these show up as a single line on your statement the way commission does — but they all reduce your net result the same way.
Here's a simplified illustration of how it stacks up for an active trader:
| Cost type | Typical visibility | Where to check it | |---|---|---| | Spread | Clearly quoted | Broker platform, /rates.html | | Commission | Clearly quoted | Broker fee schedule | | Swap | Quoted, easy to miss | Broker platform | | Slippage | Rarely quoted or tracked | Your own trade logs |
If you take 20 trades a week and average even a small amount of negative slippage per trade, that adds up to a real drag on performance over a quarter — often comparable in size to the spread itself for active strategies. The problem is that most traders never actually calculate it, so it never gets factored into whether a strategy is genuinely profitable after all-in costs.
How to Measure Your Own Slippage
You don't need special software to start measuring slippage — you need a simple habit and a spreadsheet. Here's a workflow that works for most retail setups:
1. Record the intended price — the price shown on your platform the moment you send the order. 2. Record the filled price — the actual execution price from your trade confirmation or history. 3. Calculate the difference in pips, noting direction (positive or negative). 4. Log the conditions — time of day, whether news was due, order type used, and instrument. 5. Repeat for at least 50–100 trades before drawing conclusions — a handful of trades won't tell you much. 6. Average the results by instrument and by time of day to spot patterns.
Most trading platforms store enough data in your trade history to do this retrospectively, so you can start with your last few months of trades rather than waiting for new ones.
Slippage vs Spread: Why They're Often Confused
Spread and slippage both affect your entry and exit price, which is why traders lump them together — but they're different mechanisms:
- Spread is the known, quoted gap between bid and ask at the moment of trading. You can see it before you click.
- Slippage is the unknown gap between the price you saw and the price you got, caused by market movement or execution delay.
A broker can have a tight advertised spread and still produce meaningful slippage during volatile periods, and vice versa. That's why comparing brokers on spread alone is incomplete — execution quality is a separate variable worth checking, ideally with real data rather than marketing claims.
Order Types and Broker Execution Models
Two levers affect how much slippage you're exposed to: the order type you use, and how your broker routes and fills orders.
Order types: - Market orders prioritise getting filled over getting a specific price — more exposed to slippage. - Limit orders prioritise price over certainty of fill — you may miss trades but avoid negative slippage on entry. - Stop orders can suffer the most in fast markets since they trigger a market order once the level is hit.
Execution models vary between brokers and even between account types at the same broker. For example, in Pepperstone's MetaTrader server list you'll typically see separate Standard and Razor-style accounts with different execution characteristics, and IG's own platform versus its MetaTrader offering can route and fill orders differently too. Neither broker's specific numbers should be assumed — check current execution stats and account types directly on their platforms, and use the /brokers/index.html page to compare structures side by side.
Practical Ways to Reduce Slippage
You can't eliminate slippage, but you can reduce your exposure to the worst of it:
- Avoid trading directly through major news releases if your strategy doesn't depend on the volatility.
- Use limit orders where your strategy allows, especially for entries.
- Trade higher-liquidity sessions for your chosen pairs rather than thin, illiquid hours.
- Size positions sensibly relative to typical liquidity for the instrument.
- Review your own logged data periodically rather than assuming it hasn't changed.
Conclusion: Measuring What Slippage Really Costs
Understanding what slippage really costs turns an invisible drag into a known, manageable number. Once you've logged enough trades to see your own pattern, you can weigh it against spread, commission, and swap to get a true all-in cost picture — rather than judging a broker or strategy on advertised pricing alone. Start by logging your next batch of trades, then run the full picture through PipTax's /audit.html tool alongside the /brokers/index.html comparisons to see where your real costs are actually coming from.
Key takeaways
- <parameter name="value">["Slippage is the difference between the price you expect and the price you actually get filled at — it can be positive or negative."
- "Over hundreds of trades
- negative slippage behaves like an invisible extra cost on top of spread and commission."
- "You can measure your own slippage by logging intended vs filled prices for every trade over a set period."
- "Execution quality varies by broker
- order type
- and market conditions — not just by advertised spreads."
- "Limit orders
- avoiding high-impact news
- and choosing brokers with transparent execution stats all help reduce slippage."
- "PipTax's audit tool helps you see your real all-in trading costs
- including the impact of execution
- next to live broker data."]